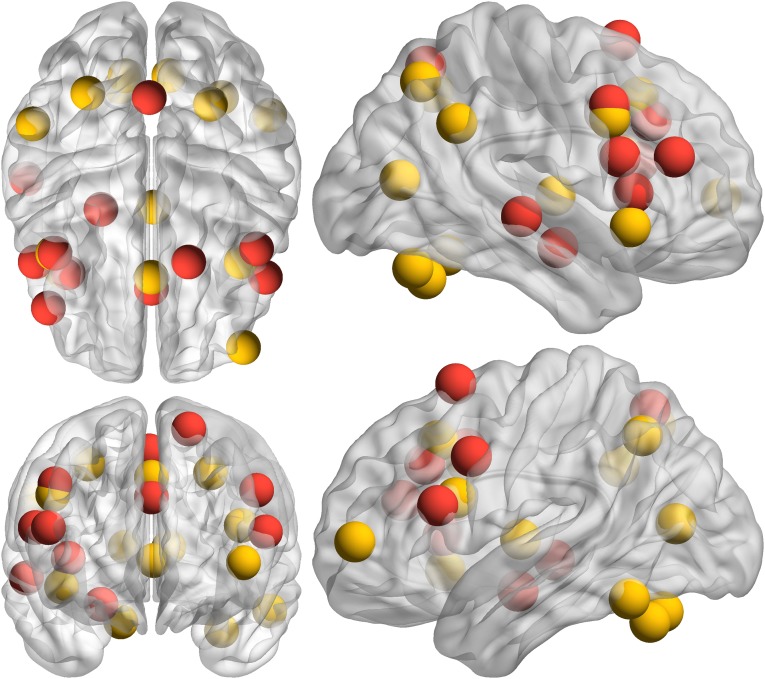
Fig. S5.
Overlap of nodes in incongruent > congruent network and within-region task activation. Red spheres are those identified in the network analysis, and yellow spheres are those identified in the within-region task activation analysis. Sphere placement in the brain reflects the center of mass location of that ROI. Upper Left is a 3D axial view from above the brain. Lower Left is a 3D coronal view from anterior to the brain (to maintain the right side of the brain on the right side of the image for both views, posterior is positioned on top for the axial view). Upper Right is a 3D sagittal view from right of the brain. Lower Right is a 3D sagittal view from left of the brain.

