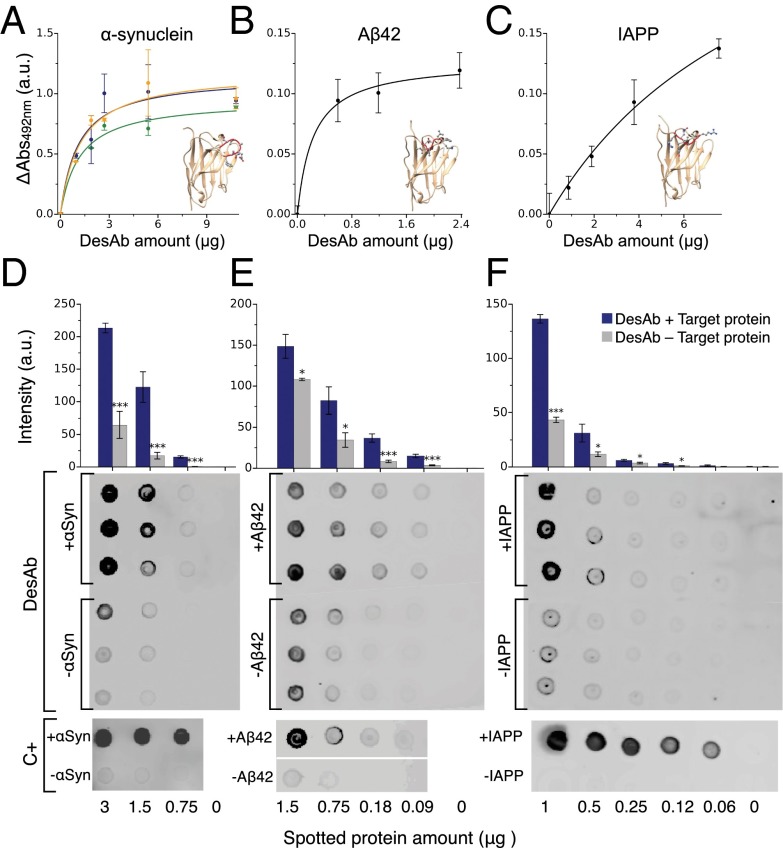
Fig. 3.
Binding and specificity of the designed antibodies (DesAb). (A–C) ELISA test of the DesAbs in Table 1 with one complementary peptide grafted in the CDR3 that specifically target α-synuclein (A) (DesAb-D in green, DesAb-E in blue, and DesAb-F in orange), Aβ42 (B) (DesAb-Aβ), and IAPP (C) (DesAb-IAPP); the lines are a guide for the eye. Homology models of the structures of the designed antibodies are represented with the grafted complementary peptide in red. (D–F) Dot blot assay performed with three DesAb variants: DesAb-F (D), DesAb-Aβ (E), and DesAb-IAPP (F) and three commercially available antibodies used as a positive control (C+) for the binding to E. coli lysates from cell lines expressing the target protein (dots labeled with +, blue columns) and not expressing it (−, gray column). In the case of DesAb-IAPP, synthetic amylin peptide was mixed to the E. coli lysate (+IAPP) before performing the experiment, as a cell line expressing IAPP was not available. Protein amount is the micrograms of total protein (lysate) spotted on the membrane. The bar plot is a quantification of the intensities of the DesAb dot blots (SI Materials and Methods). Intensities are *>2 away, ** > 3 , and *** > 4 , with and SE being the standard error from the intensities of the three dots.

