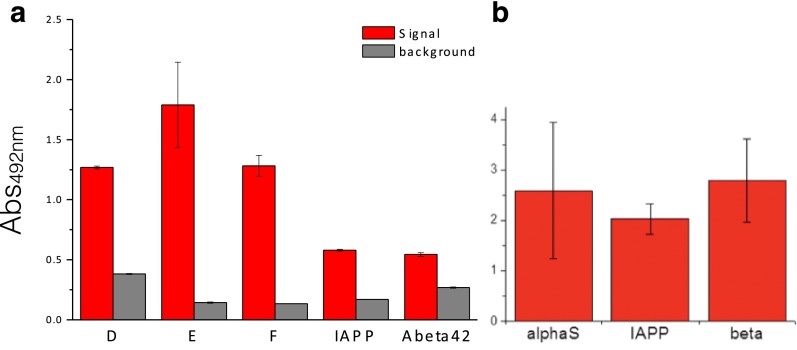
Fig. S5.
Control experiments for the ELISA tests. (A) Cross-reactivity of primary and secondary antibodies in the ELISA test. The bar plot represents the absorbance at 492 nm of ELISA wells coated with the DesAb variants (x axis; Table 1 and SI Materials and Methods) in the presence (red) and absence (gray) of the antigen protein of the DesAbs. The coated amounts were 10 μg for DesAb D, E, and F, 2.4 μg for DesAb-Aβ, and 7 μg for DesAb-IAPP. (B) Reactivity of the primary antibodies in the ELISA for their specific target.

