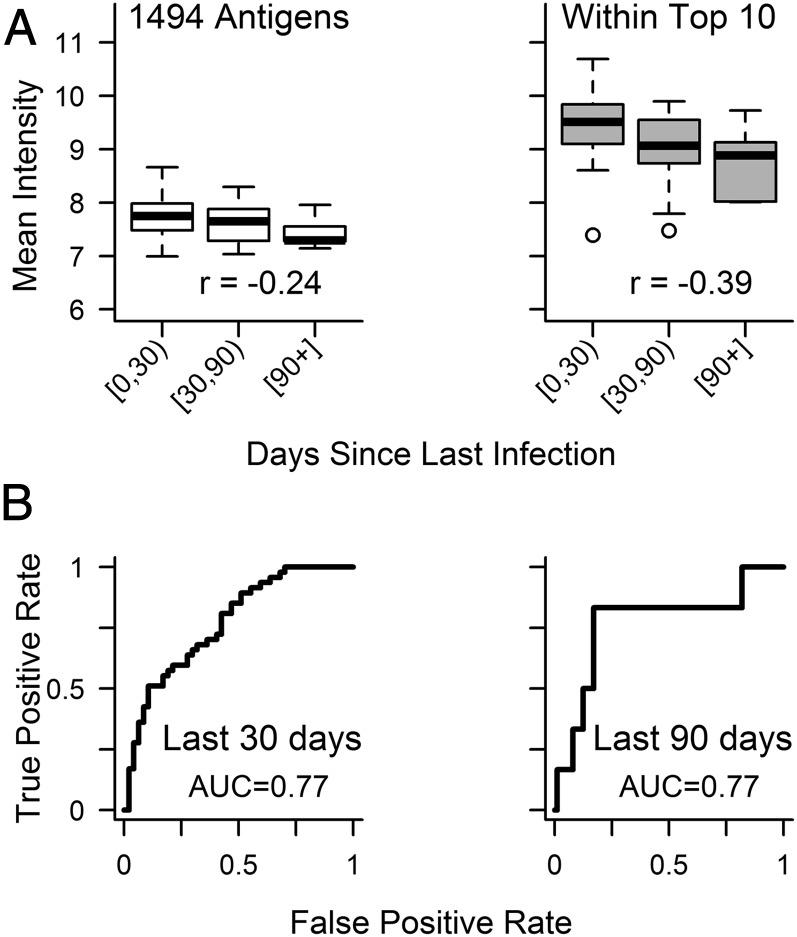
Fig. 8.
Plasma samples from Malian children were used to probe microarrays that contained 4 of the top 10 antigens inducing responses in Ugandan children that were predictive of days since last infection. (A) Mean intensity of antibody responses in Malian participants grouped by days since last infection (0 to <30 d, n = 47; 30 to <90 d, n = 41; >90 d, n = 6). (Right) Responses to antigens within the top 10 selected in Ugandans were highly immunogenic in Malian participants and also showed more consistent associations with exposure than (Left) overall responses. Spearman’s ρ for correlations between an individual’s days since last Pf infection and mean antibody response to the set of antigens indicated are presented in each plot. (B) ROC curves for predictions of days since infection from linear models using one antigen (PF3D7_0711700) and microscopy data were able to classify whether an individual from Mali was infected within the last 30 or 90 d. AUC, area under the curve.

