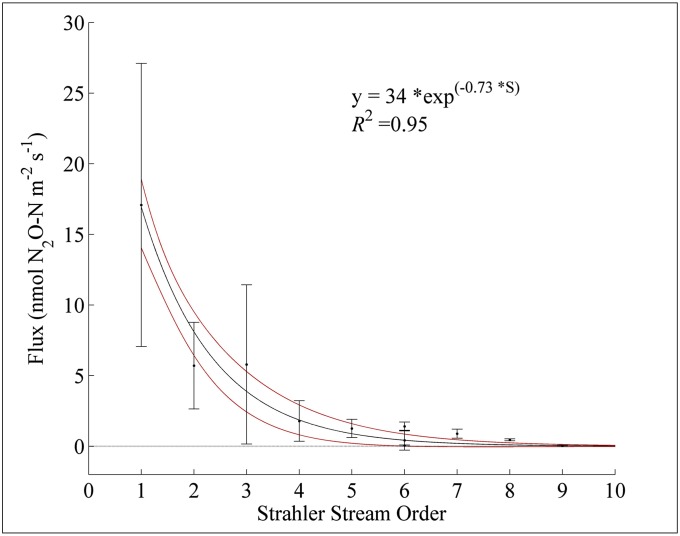
Fig. 1.
The relation between N2O flux and the Strahler stream order in southeastern Minnesota. The black line represents the best fit of an exponential function to the mean flux values measured at each stream order. Red lines represent the 95% CI of the model fit, and error bars indicate 1 SD from the mean.

