Fig. 3.
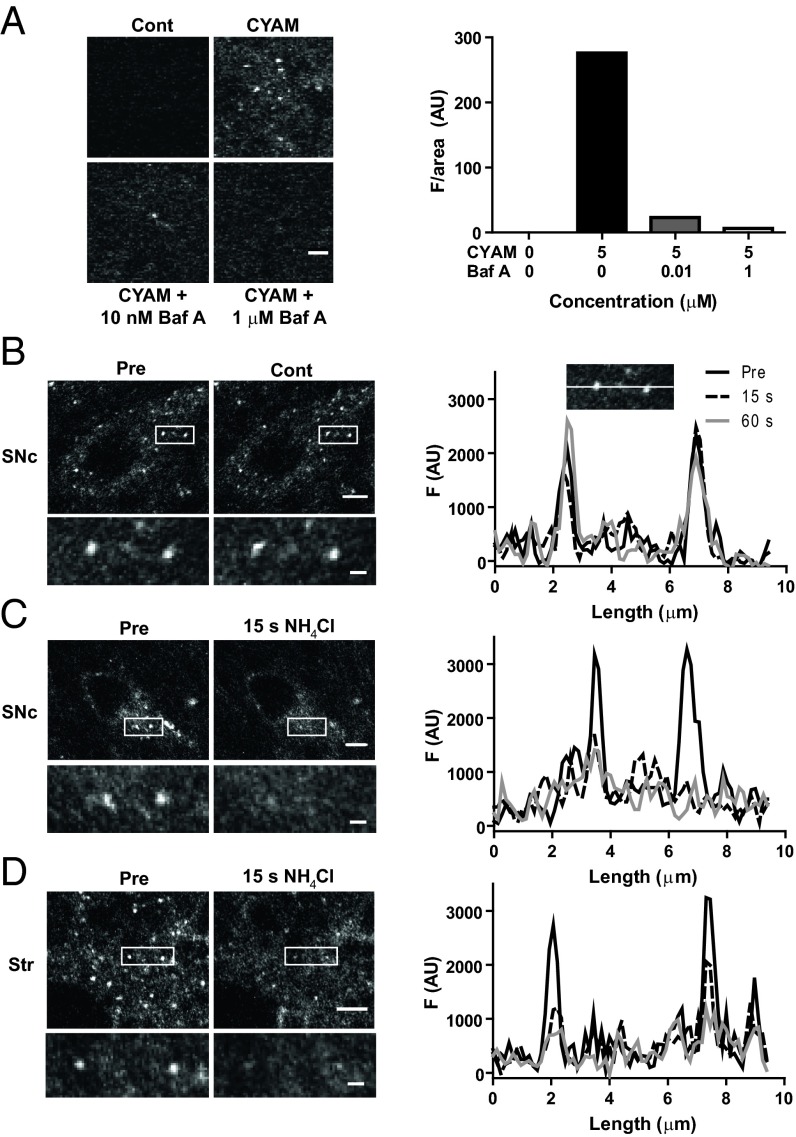
Acidic trapping of CYAM. (A) CYAM accumulation in the presence of Baf A. 2P images (Left) and quantification of CYAM fluorescence (Right) in dorsolateral striatum slices pretreated for 30 min with aCSF, 10 nM Baf A, or 1 μM Baf A and then coincubated with CYAM or aCSF [control (Cont)] for 1 h. (Right) Bars indicate mean CYAM fluorescence for two experiments. (Scale bar: 2 μm.) (B–D, Left) 2P images of CYAM fluorescence in SNc (B and C, Left) and striatum (Str; D, Left) slices before and after 5 mM NH4Cl (C and D, Left) or time-matched vehicle control (B, Left). The white box in each image indicates the region enlarged beneath. (Scale bars: whole image, 5 μm; enlarged image, 1 μm.) (B–D, Right) Profile plots of punctate fluorescence (Right) in the enlarged images (Left) are shown. (B, Right Inset) Example of where the fluorescence measurements for the profile plots were taken for the Pre, 15-s, and 60-s time points.

