Fig. 5.
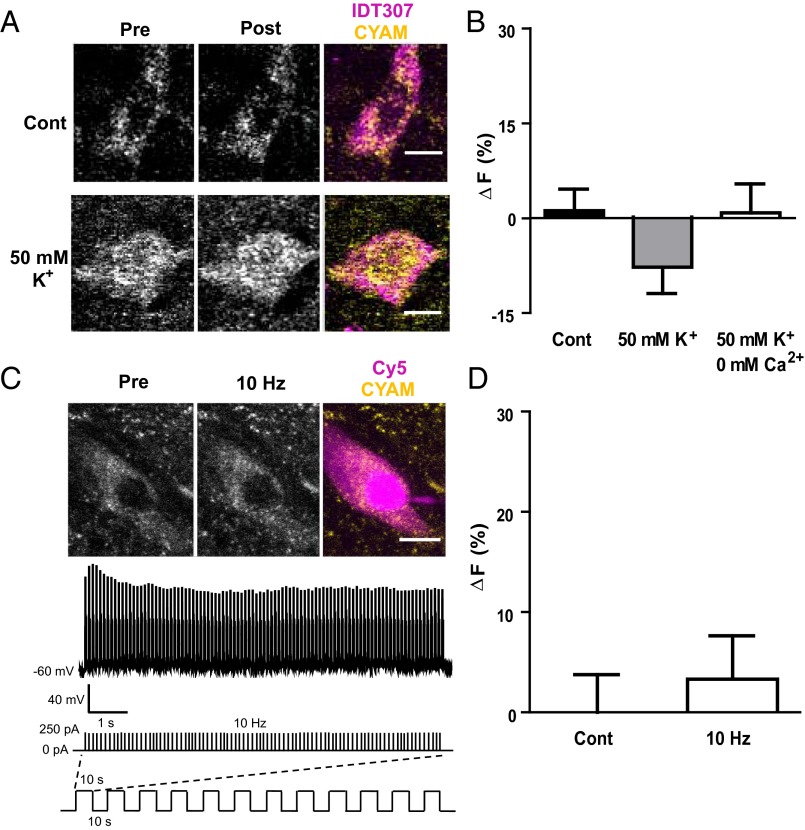
Acute depolarization and activity do not affect somatic CYAM in DA neurons. 2P images (A) and quantification of CYAM fluorescence change (B; ∆F) in SNc IDT307-positive soma before and 2 min after (Post) treatment with aCSF (control; n = 13), 50 mM K+ aCSF (50 mM K+; n = 18), and 0 mM Ca2+/50 mM K+ aCSF (B only; n = 5). IDT307 (magenta) and CYAM (yellow) fluorescence colocalization is shown in the pseudocolored overlay in A. Note that release would produce a positive value for ΔF, not the statistically insignificant negative value seen here. (C) Electrophysiologically identified CYAM containing SNc DA neurons as described in Fig. 4 A and B were electrically stimulated via patch pipette with twelve 10-s-long bouts every 10 s at a frequency of 10 Hz as depicted in the schematic at the bottom of C. Each 10-s, 10-Hz stimulation bout resulted in a train of action potentials as shown in the voltage trace in C. Representative 2P image (C, Top) and quantification of the change in CYAM fluorescence (D; ∆F) in unstimulated (control; n = 12) and electrically stimulated (10 Hz; n = 8) SNc DA neurons. The patched cell is indicated in the pseudocolored overlay with the intracellular CY5 fill in magenta and the CYAM fluorescence in yellow. Bars represent mean ± SEM. (Scale bars: A and C, 10 μm.)

