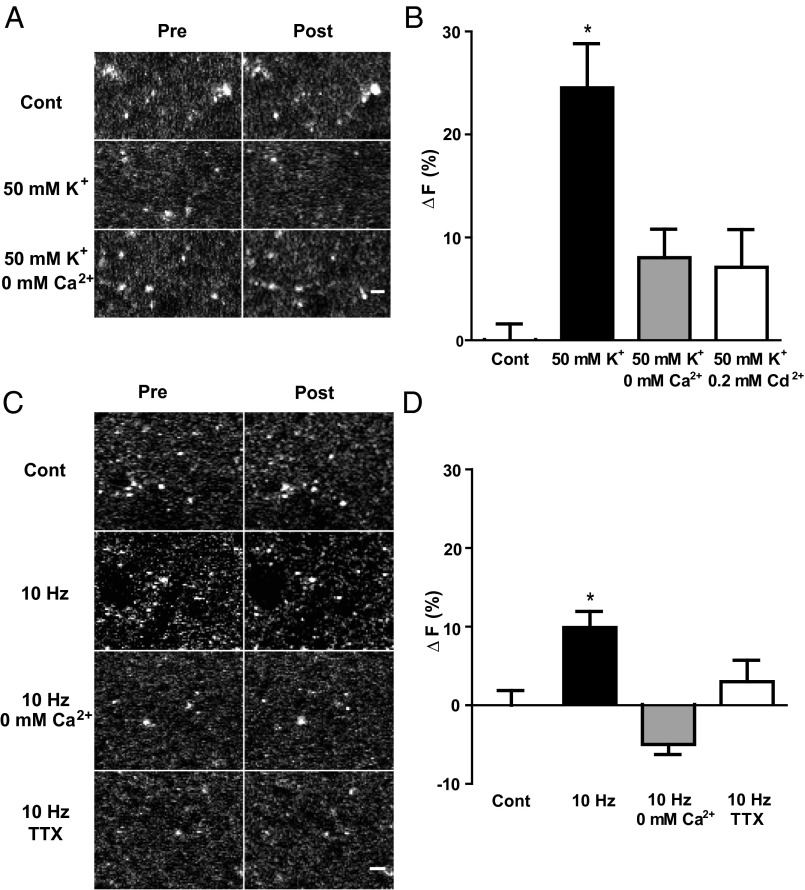
Fig. 6.
Activity and depolarization evoke Ca2+-dependent CYAM release in the striatum. 2P images (A) and quantification of the change in punctate CYAM fluorescence (B; ∆F) in striatum slices taken before and 2 min after treatment with aCSF (control; n = 7), 50 mM K+ aCSF (50 mM K+; n = 8), 50 mM K+ aCSF without Ca2+ (50 mM K+/0 mM Ca2+; n = 4), or 50 mM K+ aCSF with 0.2 mM Cd2+ (B only; 50 mM K+/0.2 mM Cd2+; n = 5). Representative 2P images (C) and quantification of the change in striatum CYAM fluorescence (D; ∆F) before and after field stimulation (10 Hz, 30 mA for 2 min) in time-matched control conditions without stimulation (n = 11), and 10-Hz stimulation in aCSF (10 Hz; n = 16), in aCSF without Ca2+ (10 Hz/0 mM Ca2+; n = 5), and in aCSF with 1 μM TTX (10 Hz/TTX; n = 8). (Scale bars: A and C, 2 μm.) Bars represent mean ± SEM. *P < 0.05.

