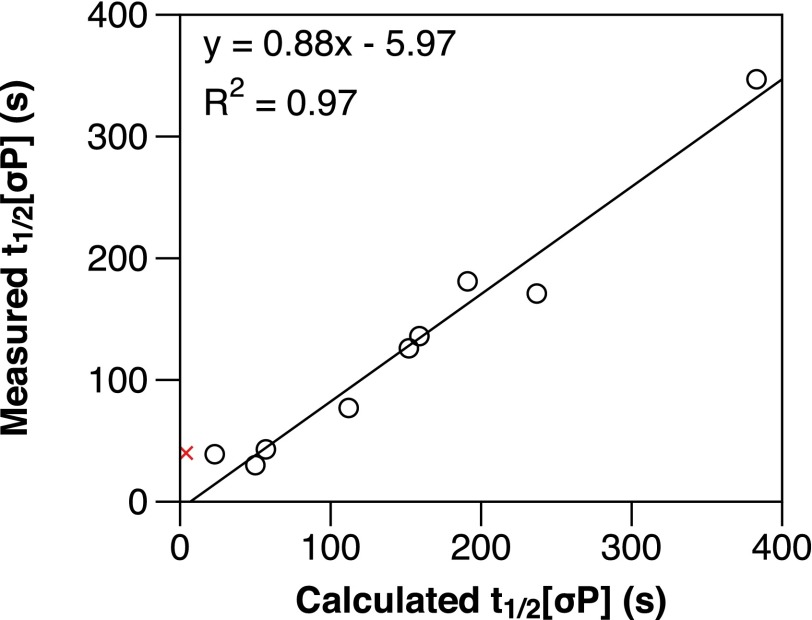
Fig. 5.
Plot of measured vs. calculated t1/2[σP] values. Measured t1/2[σP] values taken in the presence of GreB from Figs. 3 A and C, and 4 A and C, are plotted against calculated t1/2[σP] values that were obtained by applying the measurements taken in the absence of GreB from Figs. 3 B, D, and E, and 4 B, D, and E, to Eq. 1. The trend line equation and R2 value are shown. Points plotted as black circles are included in the trend line. The ConsUE value is shown as a red X and is not included in the trend line. For reasons described in the text, WT λpR′ is not plotted.

