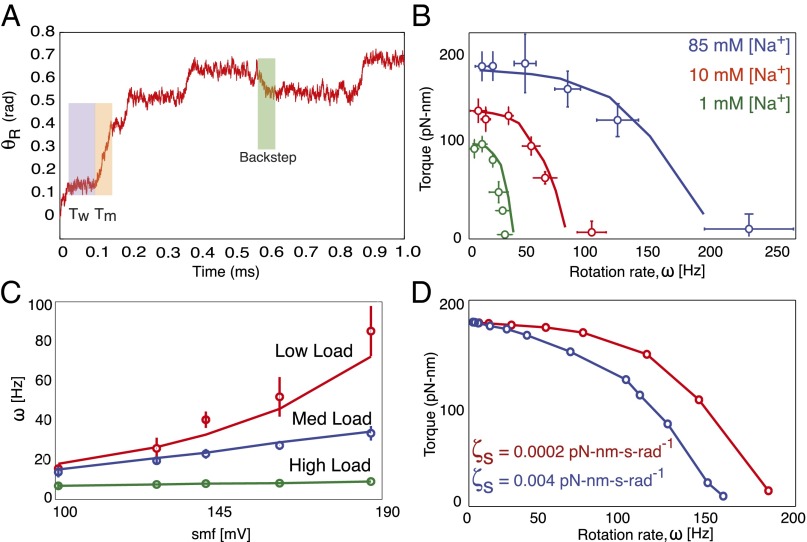
Fig. 6.
Summary of recent experiments and comparisons with model simulations. Results are derived from numerical simulations. In all plots, model calculations are shown by solid lines, and experimental data are shown as open colored circles. (A) Sample trajectory generated by the model. Moving () and waiting () times are shown with orange and purple backgrounds, respectively. Two half-steps separated by a very short pause can be seen in the highlighted forward step (orange). Occasionally, reversals (shown with green background) appear when MotA loops 2 and 4 are engaged due to conformational changes in FliG. (B) Single-stator torque–speed curves measured in a chimeric sodium motor for various sodium concentrations at pH 7.0. Curves show a concave-down shape, with the length of their plateaus being SMF dependent [data from Lo et al. (3)]. (C) Motor speed vs. SMF in a chimeric sodium motor shows a nearly linear relationship across various loads [data from Lo et al. (3)]. (D) Effect of stator viscosity on the shape of BFM torque–speed curves. The reduction in the plateau region is mainly due to the nature of the steric forces during the power stroke.

