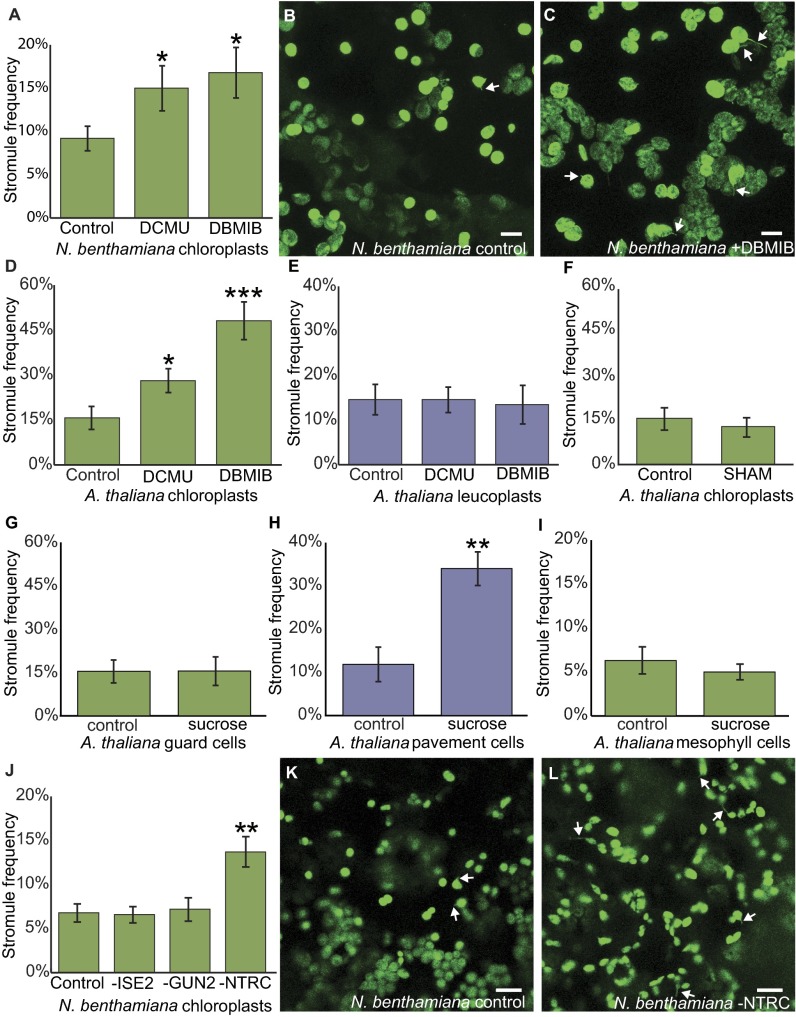
Fig. 2.
ROS in the chloroplast induce stromules. (A) DCMU and DBMIB treatments both increase stromule frequency in chloroplasts of N. benthamiana seedlings (n ≥ 20, P < 0.05). (B and C) Representative images of N. benthamiana chloroplasts treated with control (B) or with DBMIB (C). (D) A. thaliana epidermal chloroplast stromule frequency increases after DCMU or DBMIB treatment (DCMU, n ≥ 16, P < 0.05; DBMIB, n ≥ 10, P < 0.0005). (E) Stromule frequency in A. thaliana epidermal leucoplasts is unaffected by DCMU or DBMIB treatment (DCMU, n ≥ 16, P = 0.98; DBMIB, n ≥ 10, P = 0.84). (F) A. thaliana epidermal chloroplast stromule frequency is unaffected by SHAM (n ≥ 13, P = 0.57). (G) A. thaliana epidermal chloroplast frequency is similar in chloroplasts with or without sucrose treatment (n ≥ 8, P = 0.96). (H) A. thaliana epidermal leucoplast stromule frequency increases after sucrose treatment (n ≥ 8, P < 0.01). (I) Stromule frequency is not affected by sucrose treatment in A. thaliana mesophyll chloroplasts (n ≥ 8, P = 0.52). (J) Silencing NbNTRC increases stromule frequency in N. benthamiana leaves (n = 8, P < 0.01), but silencing NbISE2 or NbGUN2 does not affect stromule frequency (n = 8, P > 0.82). (K and L) Representative images of N. benthamiana chloroplasts in control (K) or after silencing NbNTRC (L). Chloroplasts and stromules in are labeled with GFP. Some stromules are indicated by white arrows. Error bars indicate SE. *P < 0.05; **P < 0.01; ***P < 0.0005. (Scale bars: 10 μm.)

