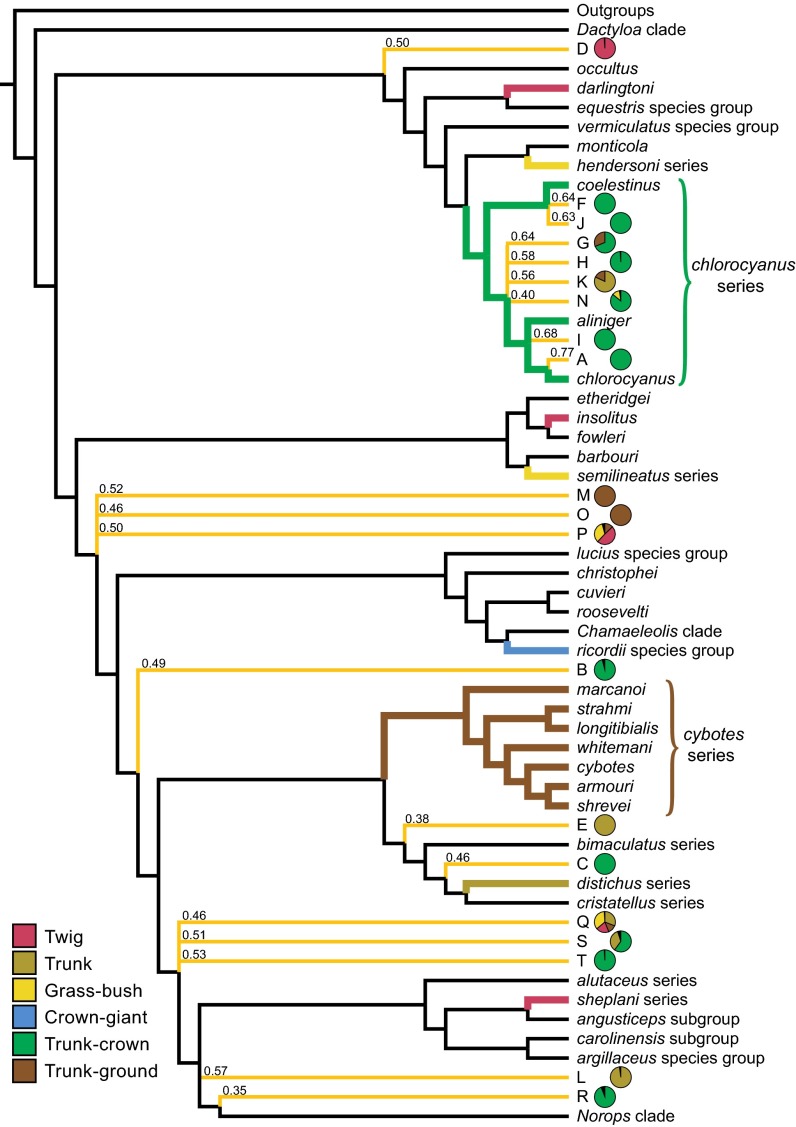
Fig. 4.
Summary tree showing the phylogenetic relationships of the amber fossils inferred by Bayesian analyses. Names of Anolis subclades are given on the right. The amber fossils are represented by letters corresponding to those in Fig. 2, and their relationships are indicated by yellow-orange branches (see Methods for details). Bayesian posterior probabilities for fossil placements are shown above branches. DFA classifications for the fossils are indicated by pie charts, colored by ecomorph (only probabilities greater than 0.1 are shown).

