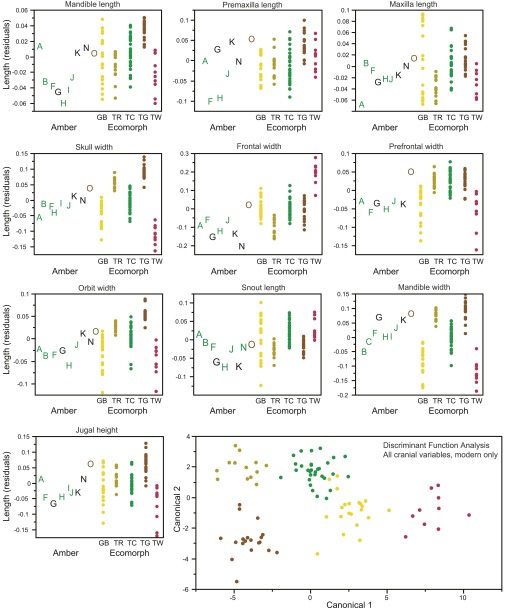
Fig. S3.
Variation among the fossils and how it corresponds with variation among the ecomorphs for all 10 cranial measurements. Size-corrected residuals are plotted for the amber fossils labeled by letters (A–T) and modern specimens (colored dots by ecomorph). Amber fossils are colored according to the DFA results (detailed in Table S3) when assigned with a probability greater than 0.90. A plot of the first two canonical variables of the DFA using all 10 variables (Lower Right) illustrates how well the cranial measurements discriminate the ecomorphs (modern specimens only).

