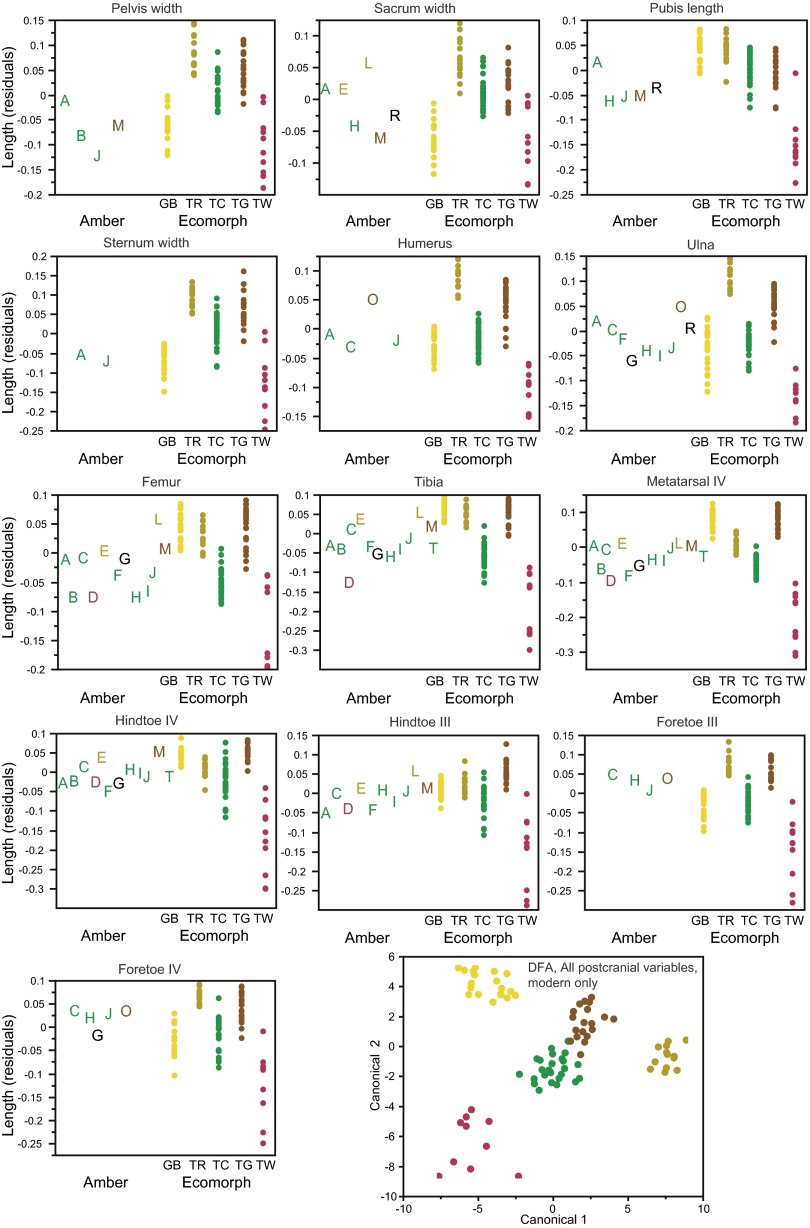
Fig. S4.
Variation among the fossils and how it corresponds with variation among the ecomorphs for all 13 postcranial measurements. Size-corrected residuals are plotted for the amber (A–T) and modern specimens. Amber fossils are colored according to the discriminant function analysis (DFA) results (Table S3) when assigned with a probability greater than 0.90. A plot of the first two canonical variables of the DFA using all 13 variables (Lower Right) illustrates how well the postcranial measurements discriminate the ecomorphs (modern specimens only).

