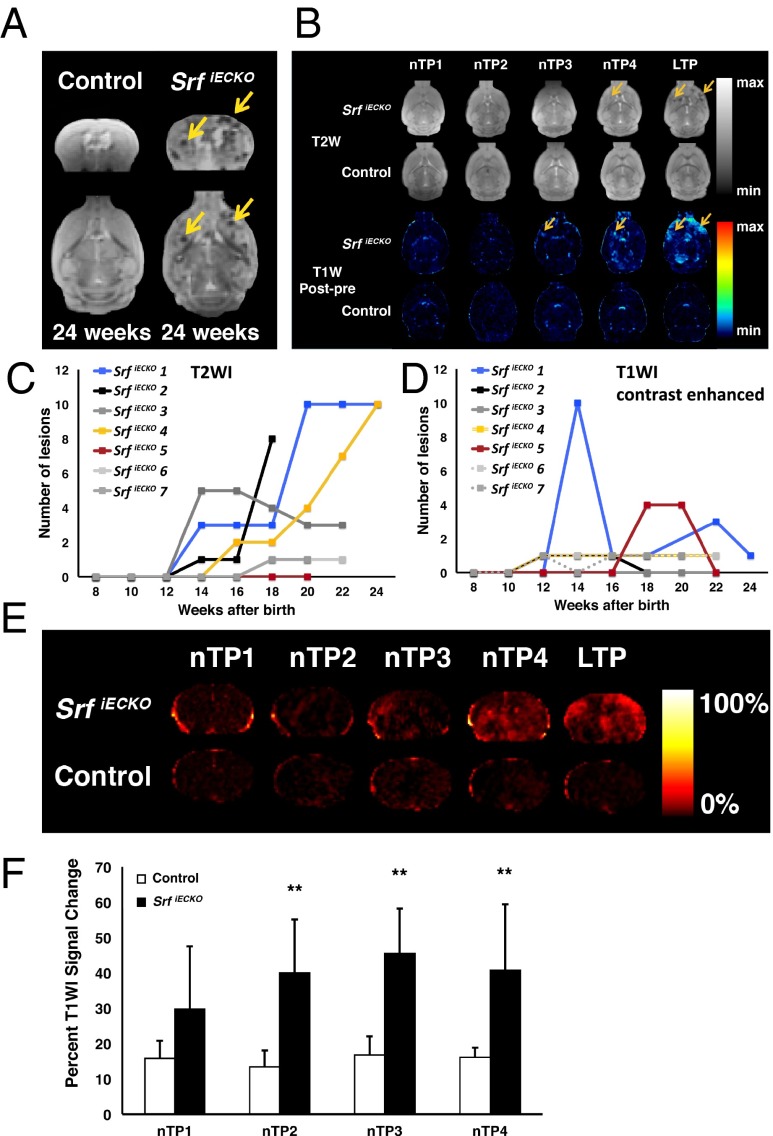
Fig. 3.
Identification and quantification over time of hemorrhagic lesions and BBB permeability by MRI. (A) T2W MR images of control and SrfiECKO animals, revealing stroke regions in SrfiECKO animals (arrows), in coronal (Upper) and transversal (Lower) sections. (B) Transversal slides of T2WI (Upper) and T1WI (Lower) subtractions of SrfiECKO and control animals. The T2WI of SrfiECKO mice exemplifies the extent of hypointense signal produced by hemorrhages. Controls presented no lesions. Arrows point toward lesion areas. Time points of analysis (nTP and LTP) are defined in SI Materials and Methods. (C and D) Time course (from week 8 to 24) of presence of T2WI (C) and T1WI (D) lesions in seven individual animals, as exemplified for one animal in B, Upper. Mice 2 and 7 died after weeks 18 and 20 of age, respectively. (E) Global T1WI signal change, an indicator of BBB permeability, elicited upon contrast agent application. (F) Quantified percent global T1WI signal change at time points indicated in E was significant at nTP2, nTP3, and nTP4. Controls presented no significant signal change. Statistical analysis: Mauchly’s test: no sphericity abnormalities (P = 0.35); ANOVA: significant overall difference (P < 0.01); Tukey’s test: significant differences at nTP2, nTP3, and nTP4. **P < 0.01. Data are presented as means ± SEM.

