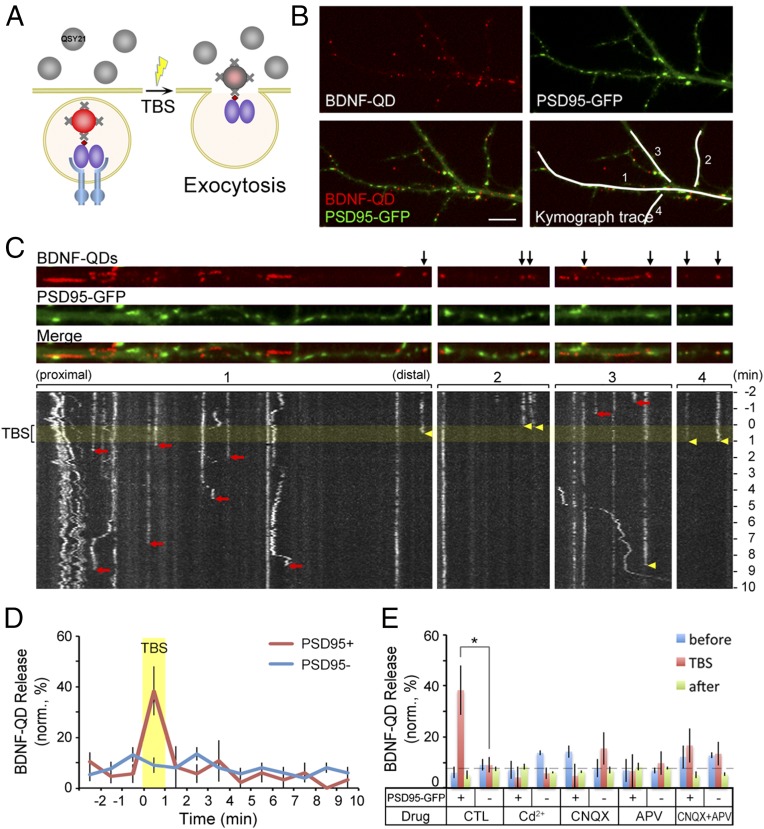
Fig. 3.
Ca2+-dependence in activity-induced secretion of BDNF-QDs at postsynaptic sites. (A) Schematic diagram depicting the experimental design for detecting secretion of endocytosed BDNF-QDs. Membrane impermeant fluorescence quencher QSY 21 (gray) was added into the culture after the hippocampal neurons had endocytosed BDNF-QDs. Secretion of BDNF-QDs was indicated by the sudden disappearance of QD fluorescence because of fluorescence quenching by extracellular QSY21. (B) Image of an example neuron containing internalized BDNF-QDs and expressing PSD95-GFP. White lines mark four dendritic segments shown in C in linearized manner. (Scale bar, 10 μm.) (C) Images on top show the distribution of BDNF-QDs and PSD95 puncta along four dendritic segments. Black arrows, BDNF-QDs that colocalized with PSD95-GFP puncta. Kymograph traces below show the changes in QD fluorescence with time for the four segments above. Yellow band, the period of TBS. Yellow arrowheads: the time of disappearance of BDNF-QDs that colocalized with PSD95-GFP puncta. Red arrows: time of BDNF-QD disappearance at PSD95-GFP− sites. (D) Quantification of the percentage of BDNF-QDs secreted (in 1-min bins) during the entire imaging session (13 min) for BDNF-QDs located at PSD95-GFP+ and PSD95-GFP− sites (n = 38 neurons from six cultures). Yellow band: the TBS period. (E) Summary of the percentage of BDNF-QDs that were secreted at PSD95-GFP+ and negative sites in the presence of Cd2+ or various blockers of glutamate receptors before (blue), during (red), and after (green) TBS. Error bars indicate SEM in all panels (n = 6 cultures; *P < 0.05 by paired t test).

