Fig. 4.
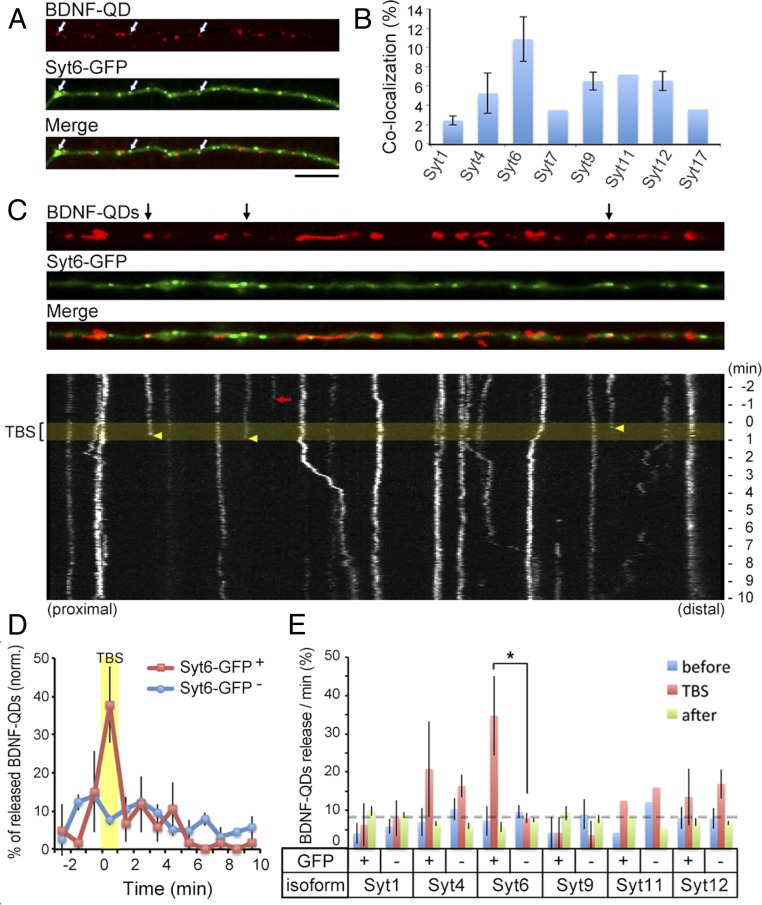
Secretion of BDNF-QDs occurs primarily at Syt6 sites. (A) Representative image of a linearized dendrite segment of a hippocampal neuron containing internalized BDNF-QDs and expressing Syt6-GFP. White arrows, colocalized BDNF-QDs and Syt6-GFP puncta. (Scale bar, 10 μm.) (B) Average percentage of endocytosed BDNF-QDs that colocalized with Syt-GFP puncta in all dendrites examined (n = 3–5 neurons each from three to six 12–15 DIV cultures for Syt1, -4, -6, -9, -12; two cultures for Syt7, -11, -17). Error bars, SEM. (C) An example of linearized dendritic segment and kymographs of BDNF-QD movements. (Upper) Black arrows, BDNF-QDs that colocalized with Syt6-GFP puncta. (Lower) Yellow band, period of TBS. Arrows mark the time of disappearance of BDNF-QDs colocalized with (yellow) or without (red) Syt6-GFP puncta. (D) Average percentage of BDNF-QDs released during 1-min time bins (normalized for each neuron) at Syt6-GFP+ or Syt6-GFP− sites in all DIV 12–16 neurons examined (n = 27 neurons from five cultures). Error bars, SEM. (E) Average percentage of BDNF-QDs released at Syt-GFP+ or Syt-GFP− sites before (blue), during (red), and after (green) TBS, for all neurons expressing one of the six Syt isoforms (n = 3–5 cultures each for all Syt1, -4, -6, -9, -12; 2 cultures for Syt11). Error bars, SEM (*P < 0.01 by paired t test).

