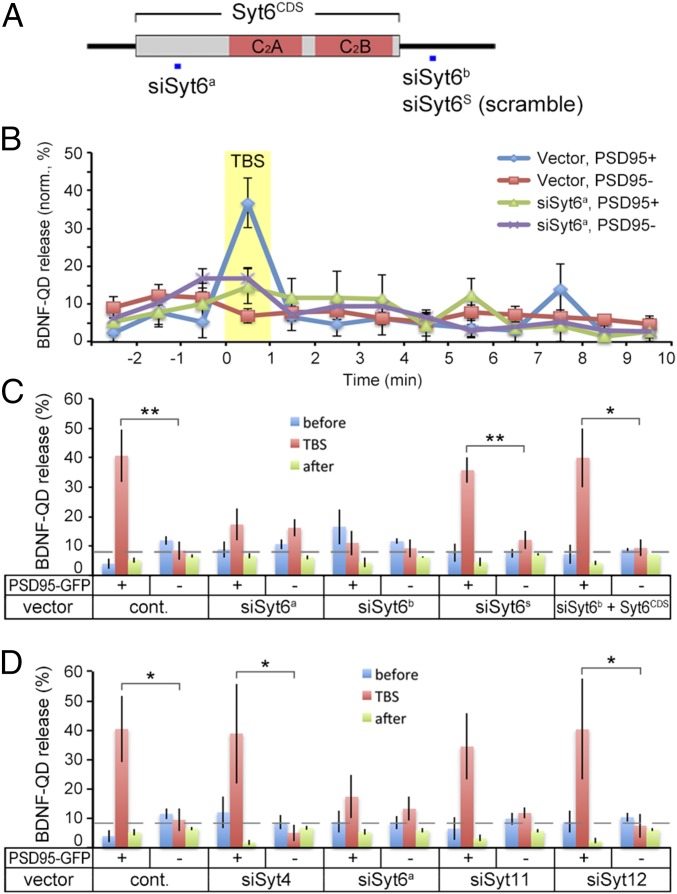
Fig. 5.
Down-regulation of Syt6 selectively impaired BDNF-QD release at postsynaptic sites. (A) Schematic structure of Syt6, with sites used for generating siRNA constructs (siSyt6a, siSyt6b, and siSyt6s with scramble sequence) marked by a square in blue. (B) Average percentage of BDNF-QDs released during 1-min time bins at PSD95-GFP+ or PSD95-GFP− site in DIV 12–16 neurons transfected with siSyt6a or control vector. Yellow band, TBS period. Error bars, SEM (n = 3–7 neurons from eight cultures each). (C) Average percentage of BDNF-QDs released per minute at PSD95-GFP+ or PSD95-GFP− sites in neurons transfected with different forms of siRNAs for Syt6 and control vector, before (blue), during (red), and after (green) TBS. Error bars, SEM (n = 3–10 cultures each; *P < 0.05 and **P < 0.01 by Student’s t test). (D) Average percentage of BDNF-QDs released per minute at PSD95-GFP+ or PSD95-GFP− sites in neurons with down-regulation of different Syt isoforms before (blue), during (red), and after (green) TBS. Error bars, SEM (n = 4–8 cultures each; *P < 0.05 by Student’s t test).

