Fig. 7.
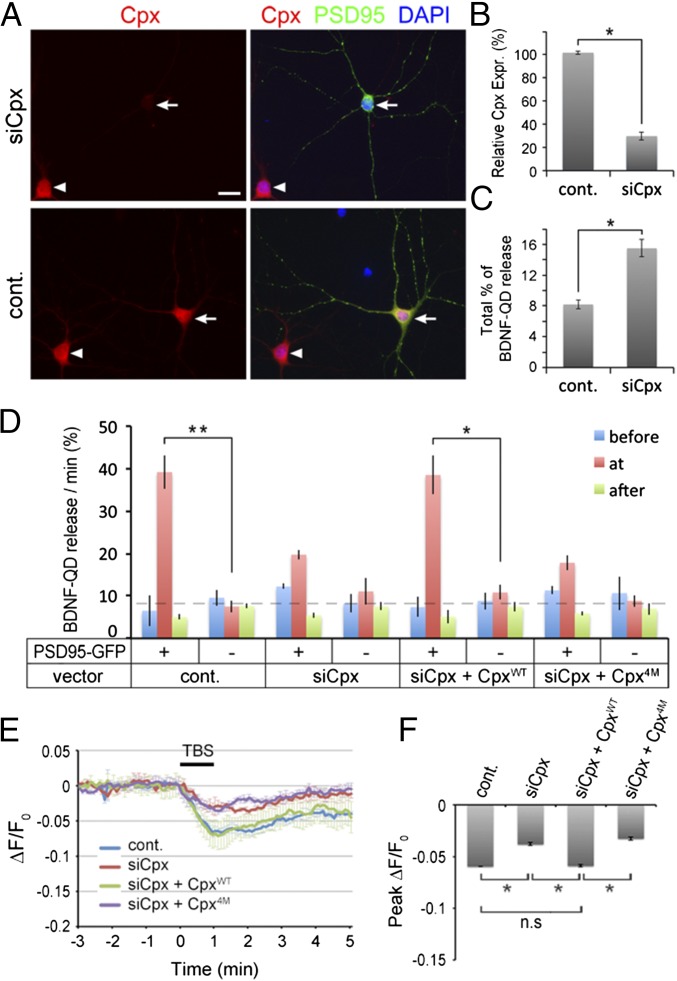
Complexin down-regulation reduced stimulation-induced secretion of BDNF-QD and BDNF-EGFP at postsynaptic sites. (A) Images of hippocampal neurons in a representative culture cotransfected with Cpx1/2 siRNA (siCpx) and PSD95-GFP. Efficient Cpx1/2 down-regulation was observed in the siCpx-transfected neuron (arrowhead, Upper), but not in untransfected cells in the same field (arrow). Arrows: transfected neurons with PSD95-GFP; arrowheads: untransfected neurons. (Scale bar, 20 µm.) (B) Quantitation of Cpx expression levels by measurements of immunostaining intensities of neurons, as illustrated in A. Relative Cpx protein levels were normalized to that of nontransfected neurons in the same image field. Error bars, SEM (n = 3 independent cultures; *P = 0.003 by paired t test). (C) The percentage of total BDNF-QDs released during the standard imaging period in control or Cpx down-regulated neurons (n = 3 independent experiments; *P = 0.003 by paired t test). (D) The average percentage of BDNF-QDs released per minute at PSD95-GFP+ or PSD95-GFP− sites in neurons transfected with indicated plasmids, before (blue), during (red), and after (green) TBS. Error bars, SEM (n = 3–4 independent cultures for each condition; *P < 0.01 and **P < 0.001 by Student’s t test). (E) Traces of average BDNF-EGFP puncta fluorescence in dendrites induced by TBS in control, siCpx, siCpx+CpxWT or siCpx+Cpx4M transfected neurons (n = 3 cultures each). Error bars, SEM. (F) Average peak reduction of BDNF-EGFP puncta fluorescence in dendrites induced by TBS, normalized to the fluorescence intensity before TBS. Error bars, SEM (n = 3 cultures each; *P < 0.001 by one-way ANOVA and Tukey post hoc test).

