
Fig. 2.
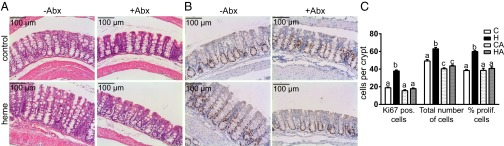
(A) Histochemical H&E staining and (B) immunohistochemical Ki67 staining of colon of control and heme-fed mice. (C) Quantification of Ki67-positive cells per crypt, total number of cells per crypt, and labeling index (percentage of proliferative cells per crypt); mean ± SEM (n = 9/group). Letters indicate significant different groups (P < 0.05), ANOVA with Bonferroni post hoc test.