Figure 2.
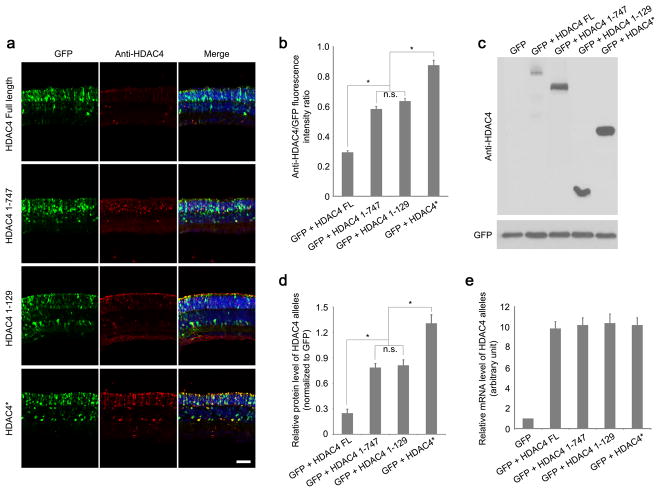
Protein expression levels of HDAC4 Full Length and HDAC4 deletion alleles. (a) Assay of HDAC4 expression using anti-HDAC4 immunohistochemistry in the electroporated rd1 retinas at P12. Scale bar, 40 μm. (b) The intensity of anti-HDAC4 immunofluorescence was quantified as a ratio to the fluorescence intensity of co-expressed GFP. *P<0.01. Data are presented as mean ± s.d., n=3. (c) Assay of HDAC4 expression at P12 using anti-HDAC4 western blots in the electroporated rd1 retinas, and quantified (d) after normalization to the co-expressed GFP. *P<0.01. Data are presented as mean ± s.d., n=3. (e) Quantitative PCR analysis of mRNA levels of HDAC4 alleles at P12 in the electroporated rd1 retinas. n=3.

