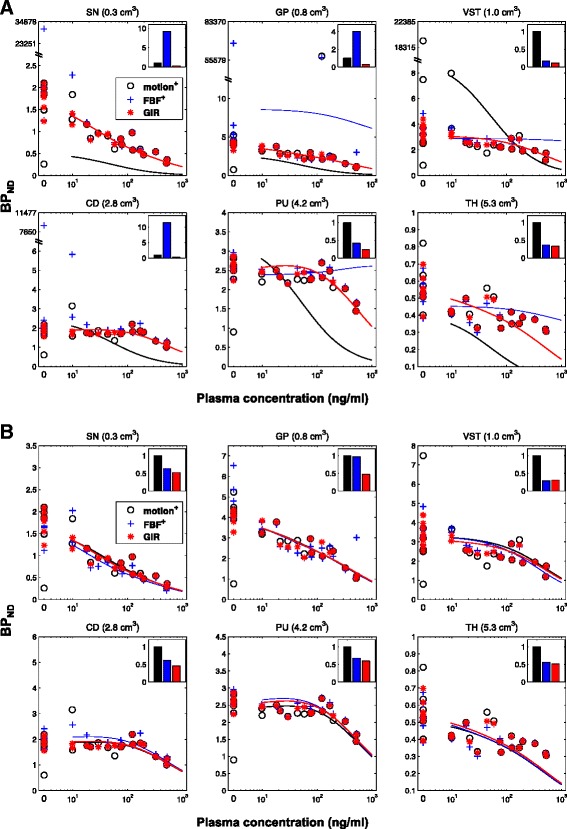
Fig. 5.

Competitive binding analysis of [11C]-(+)-PHNO data. a Fits (shown as curves) to the baseline and post-dose data before and after motion correction by FBF and GIR (shown as circles, crosses and stars) using a competitive binding model with unweighted BPND data. The unweighted sum of squared differences (SSQ) of the competitive model fitting was calculated for each BPND data set and was then scaled to the SSQ of data before motion correction so that SSQ_motion = 1. Other than for the GIR approach, all methods resulted in some unrealistic estimates of BPND that affected the fits. b Competitive model fits of BPND data points derived from PET data before MC with removal of unrealistic values; after MC by FBF with the removal of unrealistic values; after only MC by the proposed GIR
