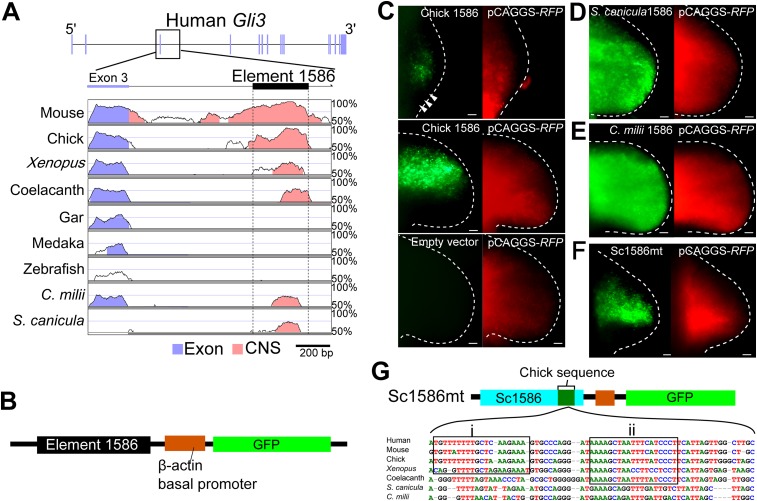
Figure 3. The Gli3 limb-specific enhancer of S. canicula and C. milii.
(A) VISTA plots of Gli3 intron 3 from indicated animals. Blue vertical bars, exons of human Gli3; black rectangle, element 1586. Regions with >70% identity are indicated: blue, exon; pink, non-coding sequences. (B) The enhancer construct. (C) GFP expression in chick forelimb buds driven by chick element 1586 at stage 19 (top, n = 3/3), stage 23 (middle, n = 14/14), and empty vector (bottom, n = 0/7). pCAGGS-RFP (right). (D–F) GFP expression driven by element 1586 of S. canicula (D, n = 11/11), C. milii (E, n = 10/10) and Sc1586mt (F, n = 4/4). Scale bars, 100 μm. (G) Scheme of Sc1586mt, S. canicula enhancer (blue) partially replaced by chick sequence (green) and alignment. Boxes indicate tetrapod (i) and sarcopterygian (ii) specific sequences.


