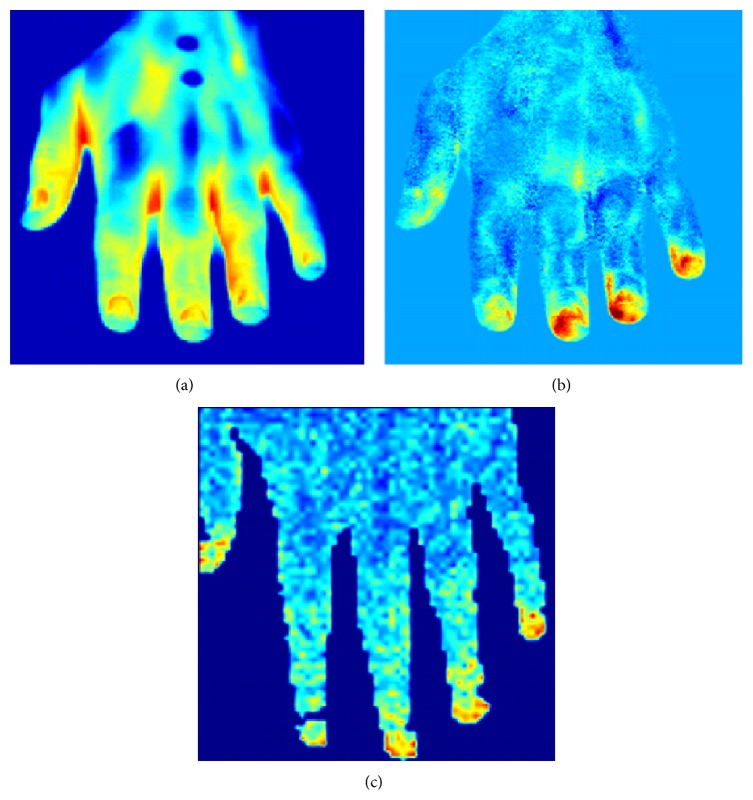
Figure 4.
Computation of cutaneous blood perfusion from thermal image series. (a) Thermal image of healthy hand; (b) cutaneous perfusion computed from thermal imagery (in arbitrary units); (c) laser Doppler image (in arbitrary units). The overall distributions appear to be consistent, both images similarly showing the same high-perfusion and low-perfusion regions.

