Figure 5.

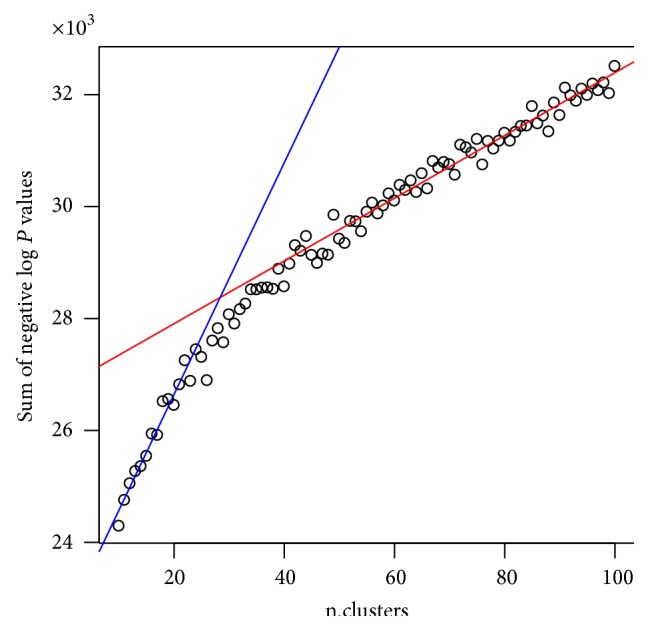
Selecting the number of clusters for the Spellman dataset by plotting sum of negative logp values against the number of clusters.

Selecting the number of clusters for the Spellman dataset by plotting sum of negative logp values against the number of clusters.