
Figure 2.
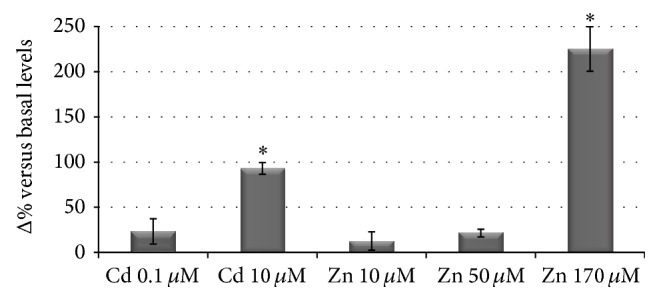
Spectrofluorimetric quantification of intracellular labile zinc. Samples are expressed as Δ% ± SD versus controls (cells grown in control medium in the presence of 25 μM Zinquin). ∗ P < 0.05 significantly different (Student's t-test) from the corresponding Cd or Zn treatment at lower concentration.