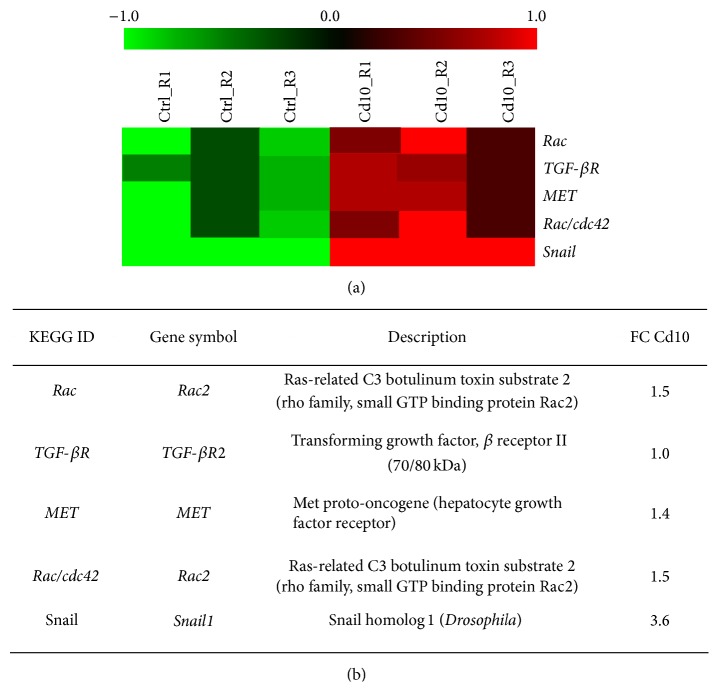
Figure 3.
The genes regulated by 10 μM Cd treatment and belonging to adherens junction pathway represented in Figure 4 are displayed. (a) Heat map graphically representing the gene regulation. Each row represents a mRNA (green = low expression, red= high expression). (b) In the table the data are expressed as log2 FC (fold change), comparing HepG2 treated with 10 μM Cd to control cells.

