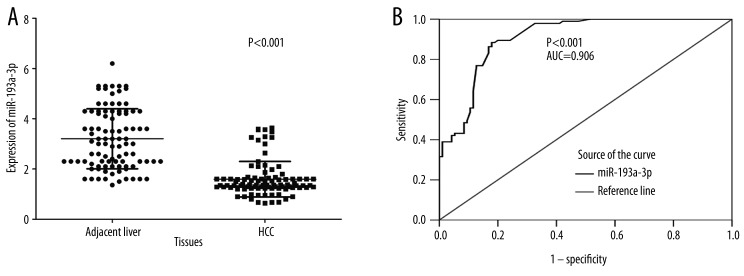
Figure 1.
Expression of miR-193a-3p in adjacent PT and HCC tissues. Quantitative real-time RT-PCR was performed to detect the expression of miR-193a-3p. (A) The difference of relevant miR-193a-3p expression between adjacent PT and HCC tissues. (B) ROC curve of miR-193a-3p expression to distinguish HCC from PT. The area under curve (AUC) of miR-193a-3p was 0.906 (95% CI: 0.864–0.948, P<0.001).

