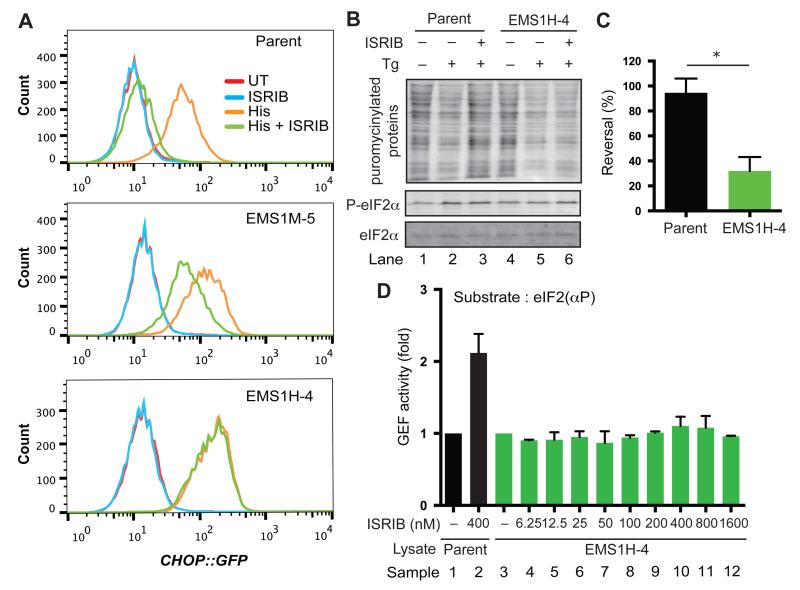
Fig. 2. Selection of ISRIB resistant (ISRIBr) mutations.
(A) Histograms of the distribution of GFP fluorescence arising from an ISR-inducible CHOP::GFP reporter gene in parental CHO-C30 cells and clones bearing the indicated mutations. The cells were left untreated or treated with histidinol (His; 0.5 mM), ISRIB (100 nM) or both. EMS1M-5 exemplifies a class of clones with a weak and EMS1H-4 a class with a strong ISRIBr phenotype.
(B) Immunoblot of puromycinylated proteins in extracts of parental CHO-C30 cells or a representative strong ISRIBr clone (EMS1H-4) following exposure to thapsigargin (Tg) in the presence or absence of ISRIB (as in Fig. 1A). The images are representative of all three independent experiments that yielded similar results. Quantified signal intensities are shown in (Fig. S5).
(C) Bar diagram, displaying the reversal of translation attenuation by ISRIB in “B” above: Reversal = [(PTg+ISRIB-PTg) ÷ (PUT-PTg)] × 100, (PTg+ISRIB, PTg and PUT are the puro signal from the sample treated with Tg and ISRIB (Lanes 3 or 6), Tg alone (Lanes 2 or 5) and the untreated sample (Lanes 1 or 3), respectively. Shown are mean ± SEM (n = 3). * P < 0.05 (Student’s t test).
(D) Bar diagram of the GEF activity of lysates from parental and strong ISRIBr mutant cells with Bodipy-FL-GDP-loaded eIF2(αP) as a substrate in the absence or presence of ISRIB, as indicated. Shown are mean ± SEM of the initial velocity of the decline in Bodipy-FL-GDP fluorescence upon adding lysate, normalized to the rate in the untreated sample (n = 4).

