. 2015 May 26;6(8):4767–4771. doi: 10.1039/c5sc01415h

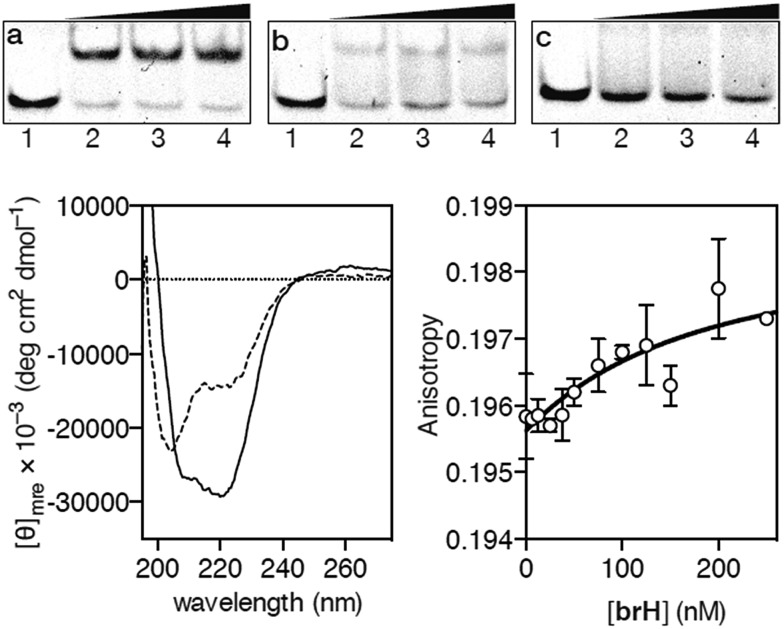
Fig. 2. EMSA DNA binding studies results for the conjugate brH. (a) Lanes 1–4: [brH] = 0, 500, 700, 1000 nM, and 75 nM AP1hs·AT dsDNA. (b) Lanes 1–4: [brH] = 0, 500, 700, 1000 nM, and 75 nM of AP1hs·GC dsDNA. (c) Lanes 1–4: [brH] = 0, 500, 700, 1000 nM, and 75 nM of GC·AT dsDNA. Oligonucleotide sequences (only one strand shown): AP1hs·AT: 5′-CGCGTCATAATTGAGAGCGC-3′; AP1hs·GC: 5′-CGCGTCATCAGCGAGAGCGC-3′; and GC·AT: 5′-GACGGAATTTGAGAGCGTCG-3′. Bottom left: circular dichroism of a 5 μM solution (phosphate buffer pH 7.5) of brH (dashed line) and the same solution after the addition of 1 equiv. of the target AP1hs·AT dsDNA (solid lane). The contribution of the DNA to the CD spectrum has been subtracted for clarity. Bottom right: fluorescence anisotropy titration of a 25 nM solution of TMR–AP1hs·AT in the presence of increasing concentrations of brH. The best fit to a 1 : 1 binding model is also shown.

Fig. 2