Figure 1.

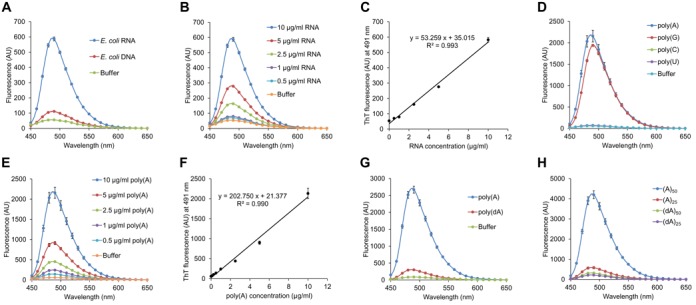
ThT quantitatively binds to purine bases of RNA. (A and B) ThT fluorescence spectra of RNA (10 μg/ml Escherichia coli total RNA) and DNA (10 μg/ml E. coli genomic DNA) were measured. (C) Fluorescence intensities at 491 nm recorded in (B) were plotted against RNA concentrations. Approximation straight line and its formula are shown with a correlation coefficient. (D, G and H) ThT fluorescence spectra of poly(A), poly(G), poly(C), poly(U), poly(dA), oligoribonucleotides (A)50 and (A)25, and oligodeoxyribonucleotides (dA)50 and (dA)25 were measured at 10 μg/ml. (E) ThT fluorescence spectra of poly(A) were measured at the indicated concentrations. (F) Fluorescence intensities at 491 nm recorded in (E) were plotted against poly(A) concentrations. The approximation line and its formula are shown with a correlation coefficient. Data points represent the means and standard deviations of results from three independent experiments. The standard deviation is less than that corresponding to the size of the symbol if no error bars are seen.
