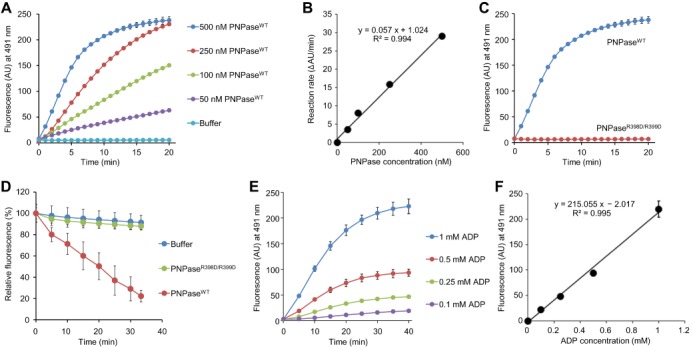
Figure 2.

ThT is available for measuring activities of PNPase in vitro. (A and B) The kinetics and PNPase dose-dependency of poly(A) synthesis can be monitored at 25°C as a function of increase in ThT fluorescence. (A) The indicated concentrations of PNPaseWT were incubated with 1 mM ADP and 25 μM ThT and the real-time increases in fluorescence were recorded by spectrofluorometer. (B) The initial rates of the increase in the intensity (ΔAU/ml) were plotted against PNPase concentrations. The approximation line and its formula are shown with a correlation coefficient. (C and D) Poly(A) synthesis and degradation activities of PNPaseWT were compared with those of PNPaseR398D/R399D. (C) Poly(A) synthesis by 250 nM PNPaseWT or 250 nM PNPaseR398D/R399D was monitored as described in (A). (D) Real-time changes of fluorescence intensity at 491 nm was monitored in the presence of 1 μM PNPaseWT or PNPaseR398D/R399D. (E) The kinetics and ADP dose-dependency of poly(A) synthesis can be monitored at 25°C in the presence of the indicated concentrations of ADP, 200 nM PNPaseWT and 25 μM ThT. (F) Fluorescence intensities recorded in (E) at 40 min were plotted against ADP concentrations. The approximation line and its formula are shown with a correlation coefficient. Data points represent the means and standard deviations of results from three independent experiments. The standard deviation is less than that corresponding to the size of the symbol if no error bars are seen.
