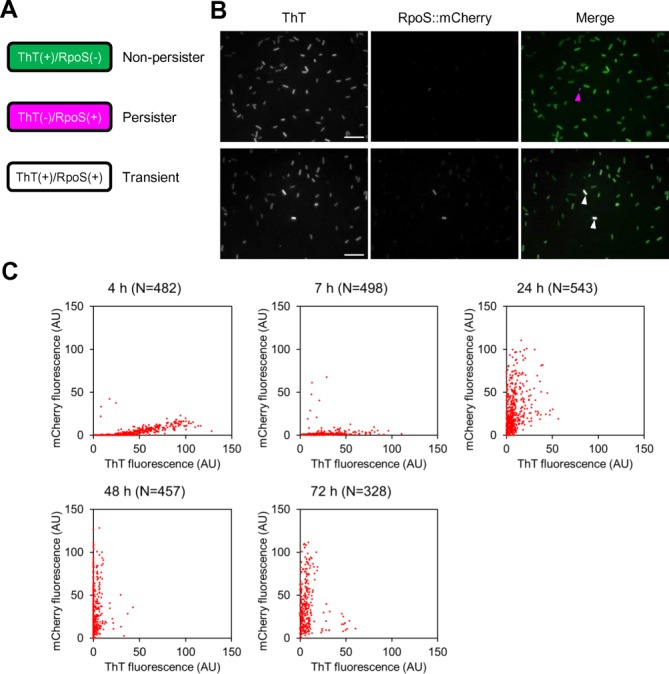
Figure 5.

ThT is applicable for visualizing transitions between non-persister cells and persister cells. (A) Using an RpoS::mCherry reporter system, persister cells can be distinguished from non-persister cells as red fluorescent cells (pseudo-coloured in magenta). Non-persister cells are actively dividing and their mRNA level may be high enough for representing bright ThT fluorescence (green) in the presence of the fluorescence probe. Transient state cells (from non-persister to persister state or vice versa) are thought to exhibit green and magenta and are therefore in white when both fluorescence images are merged. (B) ThT fluorescence and mCherry fluorescence images of Escherichia coli MG1655 rpoS::mcherry cells at log phase (4 h) are shown in grey scale. These images are merged in the right panel. Many green cells and a few magenta cells are observed at the indicated time points. Magenta and white arrowheads represent ThT-negative/RpoS::mCherry-positive (persister) and ThT-positive/RpoS::mCherry-positive (transient) cells, respectively. Scale bars represent 10 μm. (C) E. coli MG1655 rpoS::mcherry cells were harvested and observed under fluorescence microscopy at the indicated periods. Intensities of ThT fluorescence and mCherry fluorescence of individual cells were quantified using Image J and plotted. Growth curve and microscopic images of the strain are shown in Supplementary Figures S5 and S6, respectively.
