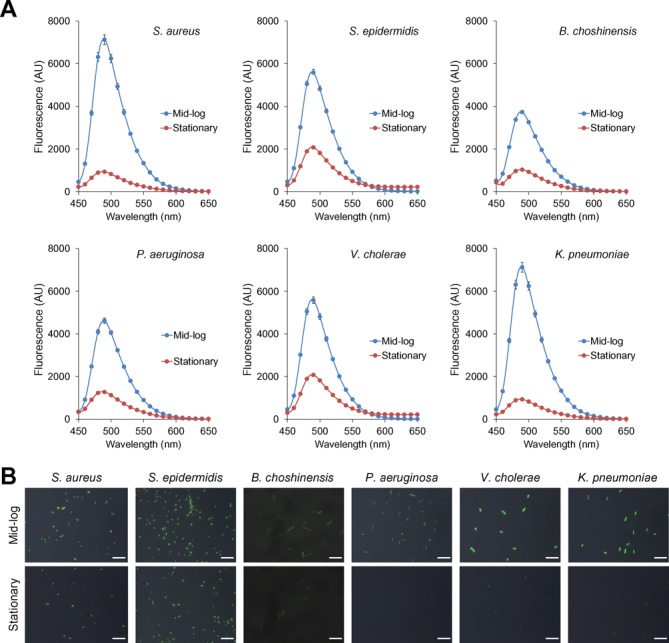
Figure 6.

ThT stains various bacterial cells in a growth-phase-dependent manner. (A) Gram-positive (Staphylococcus aureus, Staphylococcus epidermidis and Brevibacillus choshinensis) and Gram-negative bacterial cells (Pseudomonas aeruginosa, Vibrio cholerae and Klebsiella pneumoniae) were harvested at the mid-log (3–5 h) and stationary phases (24 h) and were suspended into PBS containing 25 μM ThT. Fluorescence spectra were recorded with excitation at 438 nm. Data points represent the means and standard deviations of results from three independent experiments. The standard deviation is less than that corresponding to the size of the symbol if no error bars are seen. (B) Fluorescence and phase contrast images of the indicated bacteria are captured in the presence of ThT. Merged images of ThT fluorescence and phase contrast images are shown. Scale bars represent 10 μm.
