Figure 6.

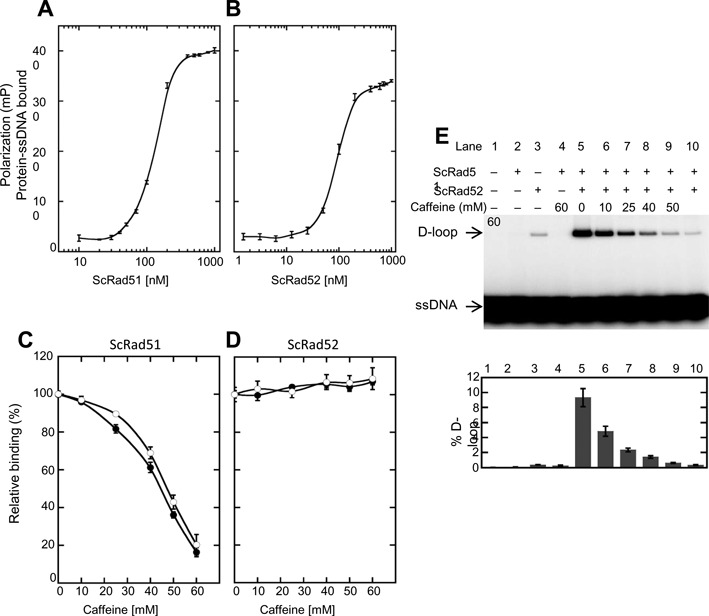
Effect of caffeine on ssDNA binding and D-loop activity. (A) Protein–DNA binding curves for Rad51 determined by fluorescence polarization assay. Protein at various concentrations was incubated with fluorescein-tagged 84-mer ssDNA (200 nM nucleotides or 2.4 nM molecules) in buffer B and incubated at 37°C for 30 min. Error bars represent standard deviation from triplicate trials. (B) Same as (A) except Rad52 replaced Rad51. (C) Caffeine (10, 25, 40, 50 and 60 mM) was added to pre-formed Rad51-ssDNA filaments (closed circles) or to Rad51 and ssDNA before filament formation (open circles). Rad51 was 150 nM. Binding was determined by fluorescence polarization as before. Data were normalized to the signal level observed in the absence of caffeine. (D) Same as in (C) except 100 nM Rad52 replaced Rad51. (E) The D-loop activity of Rad51 (1.2 μM) mediated by Rad52 (2.4 μM) was measured in the presence of increasing concentrations of caffeine. Upper panel: autoradiogram following electrophoretic separation of D-loops from free 32P-labeled ssDNA oligo substrate. Lower panel: quantitation of the autoradiogram shown in the upper panel together with results from two additional experiments (corresponding gels are not presented). Error bars represent standard deviation. Note: Rad52 has a low level of intrinsic D-loop activity which is not stimulated by Rad51 (25), as is evident in the control reaction shown in lane 3.
