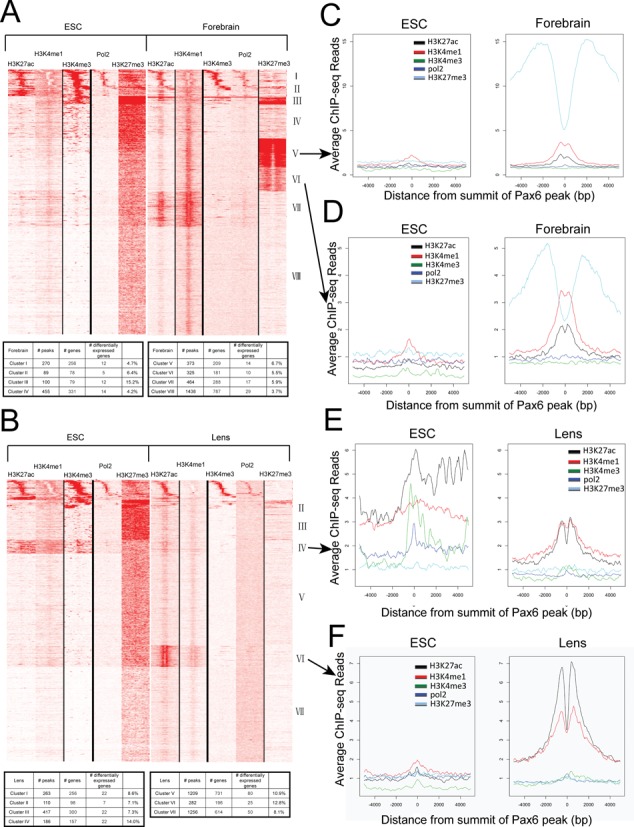
Figure 6.

Heatmaps showing the co-occurrence of Pax6, core histone PTMs and RNA polymerase II. (A) Heatmap of maximal read coverage in 50 bp bins from −5 kb to +5 kb of the peak summits at forebrain Pax6 peaks (n = 3514). ChIP-seq data from H3K4me1, H3K4me3, H3K27ac, H3K27me3 and RNA polymerase II in ES cell and forebrain chromatin shown as labeled. The numbers of Pax6 peaks from clusters I to VIII are shown in table format. (B) Heatmap of maximal read coverage in 50 bp bins from −5 kb to +5 kb of the peak summits at lens Pax6 peaks (n = 3723). ChIP-seq data from H3K4me1, H3K4me3, H3K27ac, H3K27me3 and RNA polymerase II in ES cell and lens chromatin shown as labeled. The numbers of Pax6 peaks from clusters I to VII are shown in table format. (C–F) Profiles of H3K4me1, H3K4me3, H3K27ac, H3K27me3 and RNA polymerase II at forebrain Pax6 peaks in ES cell, forebrain and lens chromatin at individual clusters. Y-axis shows the read density per 50 bp averaged over Pax6-bound peaks in each tissue from −5 kb to +5 kb of the peak summits. Data were normalized to a read depth of 10 million mapped reads. Formation of forebrain-specific class II enhancers compared to their status in ES cells in clusters V and VI marked by H3K27me3 in both cell types (panels C,D). Activation of poised and inactive enhancers in ES cells in lens identified by clusters IV and VI (panels E,F), respectively.
