
Figure 3.
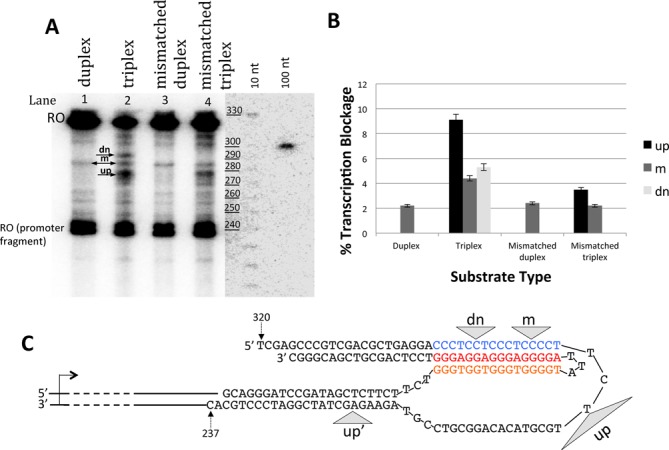
T7 RNAP transcription is arrested by triplexes. (A) Gel analysis of transcription products at standard conditions. The most pronounced blockage bands (designated as ‘up’, ‘m’ and ‘dn’ are marked by arrows. DNA size standards (10 and 100 nt ladders) are shown at right. (B) Quantification of the results from panel (A). Each construct was transcribed at least twice, and the columns correspond to average blockage intensity for different constructs at different positions along the template. Error bars show standard deviations. (C) Mapping of the blockage sites in H-DNA structure obtained by interpolation from the reference size ladder. Blockage sites are shown by gray triangles. Signals ‘up’, ‘m’ and ‘dn’ are seen at all conditions (e.g. Figure 3A), while the additional signal ‘up’ appears only in the presence of Mn2+ ions (see Figure 4). Triangle width roughly corresponds to the resolution of the mapping (about 5 nt).