
Figure 3.
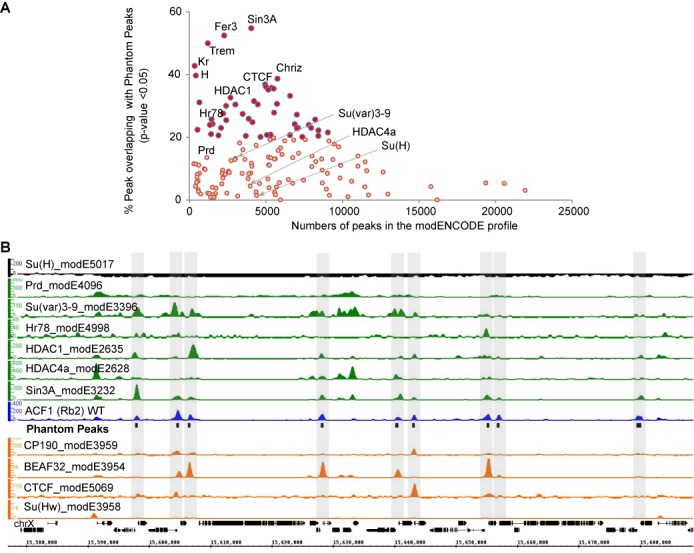
Phantom Peaks coincide with peaks of several modENCODE profiles. (A) Peaks called by modENCODE on 153 different non-histone chromatin factors were tested for overlap with Phantom Peak regions. For each profile the scatterplot graph depicts the number of peaks defined by modENCODE and the fraction of these peaks overlapping with Phantom Peaks (P-value <0.05). The P-values indicate the significance of proximity of the modENCODE profile peaks to the Phantom Peaks. (B) Smoothed and background-subtracted tag density profiles of selected modENCODE profiles are shown in a representative genomic region on chromosome X. The positions of Phantom Peaks are indicated by black boxes and gray-shaded rectangles across all profiles.