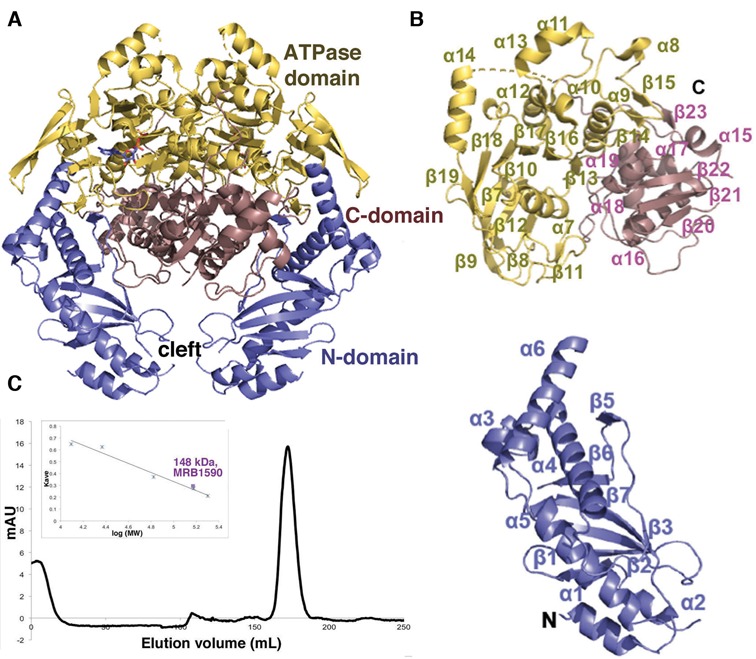
Figure 2.

Structure of MRB1590. (A) Overall structure of MRB1590 with the N-domain, central ATPase domain and C-domain labeled and colored blue, yellow and pink, respectively. (B) Ribbon diagram showing the domains in (A) with secondary structural regions labeled. The N-terminal and C-terminal residues are also labeled. C) Size exclusion chromatography analyses of MRB1590. The protein runs as a dimer with a MW of 148 kDa (the monomer MW is 72 kDa). Shown is the elution profile and inset is the generated curve used to determine the MW, where the y axis is the elution volume normalized for column volume and the x axis is the log of the molecular weight (MW). The standards used for the analyses are cytochrome c (12.4 kDa), trypsin (23.3 kDa), albumin (66.4 kDa), alcohol dehydrogenase (150 kDa) and β-amylase (200 kDa).
