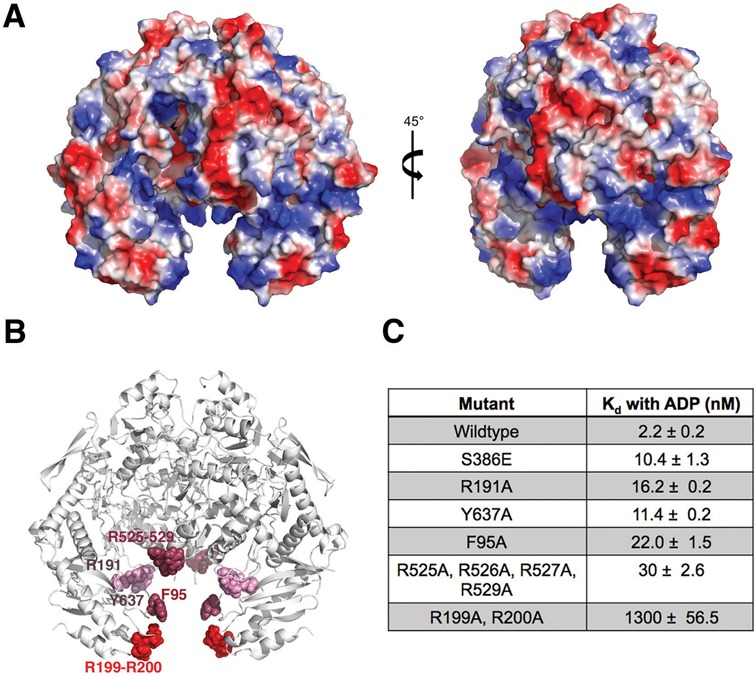
Figure 5.

Electrostatic surface potential of MRB1590 and location of its RNA binding region. (A) Electrostatic surface representation of MRB1590, where blue and red represent positive and negative regions, respectively. The protein is shown in two orientations whereby the figure to the right shows the structure at a 45° rotation relative to the figure on the left. (B) Mapping the RNA binding region of MRB1590. Shown is a ribbon diagram of MRB1590 with the residues that were mutated to alanine shown and colored according to the impact of their mutation on RNA binding (labeled for one subunit). Mutations of residues that are colored red had a significant impact on RNA binding, residues in dark pink impacted RNA binding by 10-fold or more while residues colored light pink had little effect on RNA binding. (C) Table summarizing the Kds obtained for RNA binding by the MRB1590 mutants for theGC-rich sequence in the presence of ADP.
