Figure 4.

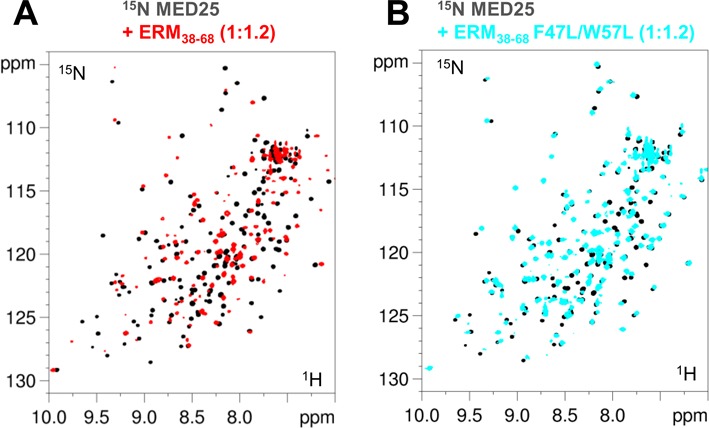
Spectra of MED25. 2D [1H, 15N] HSQC spectra of 100μM 15N,13C-MED25 free in solution (black) or with 1.2 molar amount of (A) ERM38–68 (overlaid in red) and (B) F47L/W57L-ERM38–68 (overlaid in blue).

Spectra of MED25. 2D [1H, 15N] HSQC spectra of 100μM 15N,13C-MED25 free in solution (black) or with 1.2 molar amount of (A) ERM38–68 (overlaid in red) and (B) F47L/W57L-ERM38–68 (overlaid in blue).