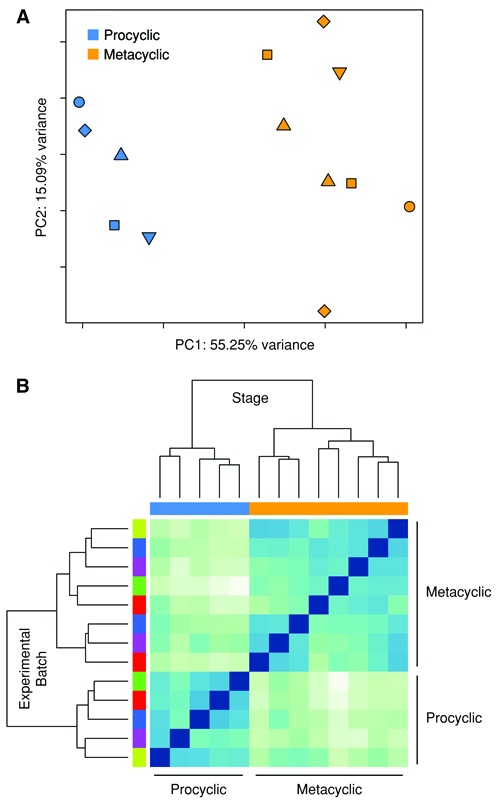
Figure 1.

Global gene expression profiles of the procyclic and metacyclic promastigote forms of Leishmania major. RNA-seq was carried out on L. major procyclic (log phase) promastigotes and metacyclic promastigotes isolated after enrichment using Ficoll or PNA. A principal component analysis (PCA) plot (A) and heatmap of a hierarchical clustering analysis using the Euclidean distance metric (B) are shown. Both analyses were performed using all L. major annotated genes (8475) after filtering for low counts, quantile normalization and accounting for batch effects in the statistical model used by limma. In the PCA plot, each point represents an experimental sample with point color indicating L. major developmental stage (blue = procyclic promastigote, orange = metacyclic promastigote) and point shape indicating batch/experimental date. Colors along the top of the heatmap indicate the developmental stage (blue = procyclic promastigote, orange = metacyclic promastigote) and colors along the left side of the heatmap indicate the batch/experimental date.
