
Figure 1.
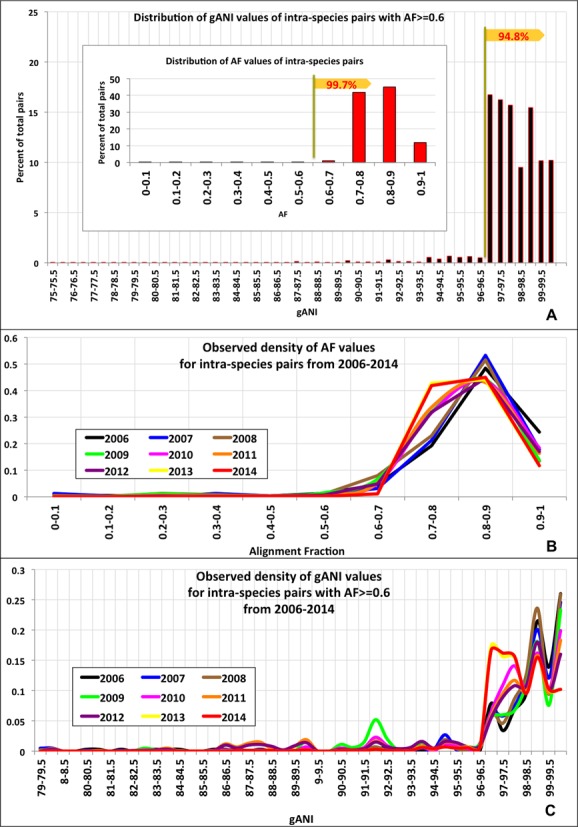
Determination of species-level AF and gANI values (A) Distribution of AF values of all intra-species pairs (inset) and gANI values of those intra-species pairs that have AF ≥ 0.6 (B) Distribution of AF values evaluated at multiple time points (yearly, 2006–2014). (C) Distribution of gANI values evaluated at multiple time points (yearly, 2006–2014).