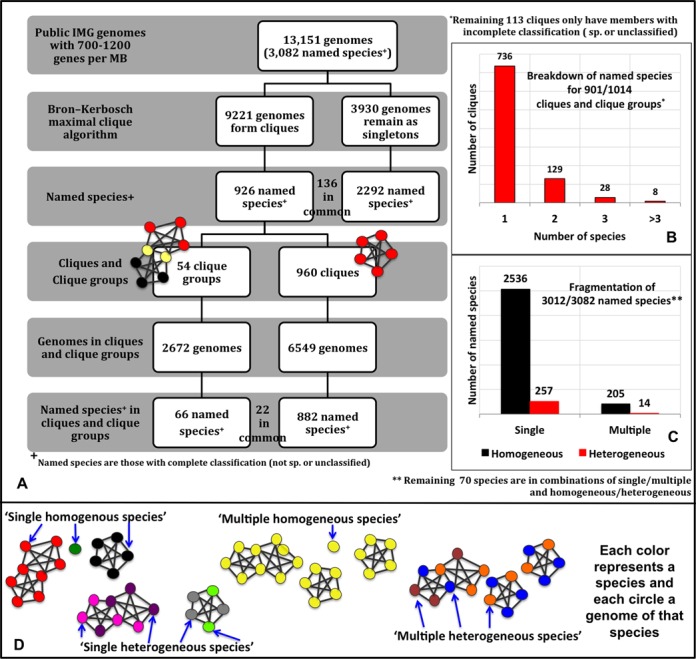
Figure 2.

(A) Breakdown of genomes and species into cliques, clique groups and singletons. This figure shows the number of genomes and named species at each step of our method. The genomes/species in common are annotated between the boxes. (B) Breakdown of named species for 901 clusters. This graph shows how many clusters are populated by one species, two species and so on. (C) Breakdown of species into different categories. This graph shows how many species fall into the ‘single homogeneous’, ‘multiple homogeneous’, ‘single heterogeneous’ and ‘multiple heterogeneous’ species category. (D) Pictorial description of the species categories. Each color represents a species and each circle a genome of that species. Species ‘black’ is present only in one clique and that clique only has genomes of that species, making it a ‘single homogeneous species’. Species ‘pink’ has genomes in only one clique group, but that clique group has genomes from other species (‘purple’), thus making it a ‘single heterogeneous species’. The genomes of species ‘yellow’ are present in multiple clusters, but each cluster they belong to only have genomes of that species, making it a ‘multiple homogeneous species’. Species ‘blue’ has genomes in multiple clusters and each cluster has genomes of other species (orange, brown), thus making species ‘blue’ a ‘multiple heterogeneous’ species.
