
Figure 3.
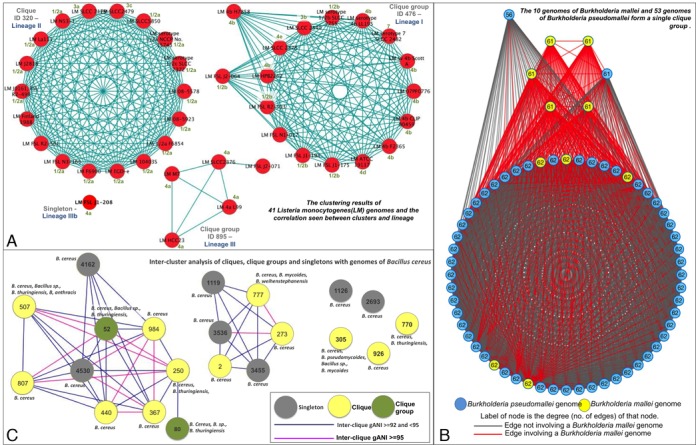
Validation of results. (A) The clustering results of 41 Listeria monocytogenes (LM) genomes and the correlation seen between clusters and lineage. Each red circle depicts a genome and each blue line depicts an gANI ≥ 96.5 and an AF ≥ 0.5 between the two genomes it joins. Genome name is annotated in black where LM stands for Listeria Monocytogenes, the lineage associated with each group is specified in dark blue and known serotype information for each genome is specified in green (B) Cluster based analysis of Bacillus cereus group. Each circle represents a cluster or singleton, with a gray circle depicting a singleton, a yellow circle depicting a clique and a green circle depicting a clique group. A pink line depicts the inter-cluster gANI if it falls between 92 and 95, and blue line if it is between 95 and 96.5. The species present in each cluster is annotated with text above/below/next to the cluster. (C) Pictorial description of the Burkholderia mallei and Burkholderia pseudomallei clique group. Each circle represents a genome, where a yellow circle represents a B.mallei genome and a blue circle represents a B.pseudomallei genome. Each line or edge depicts an gANI ≥ 96.5 and AF ≥ 0.5 between the two genomes it joins. More specifically, a red line is an edge involving a B.mallei genome and a gray line is an edge that does not. The degree of the genome/node (the number of genomes with which it has the required gANI and AF) is annotated in black.