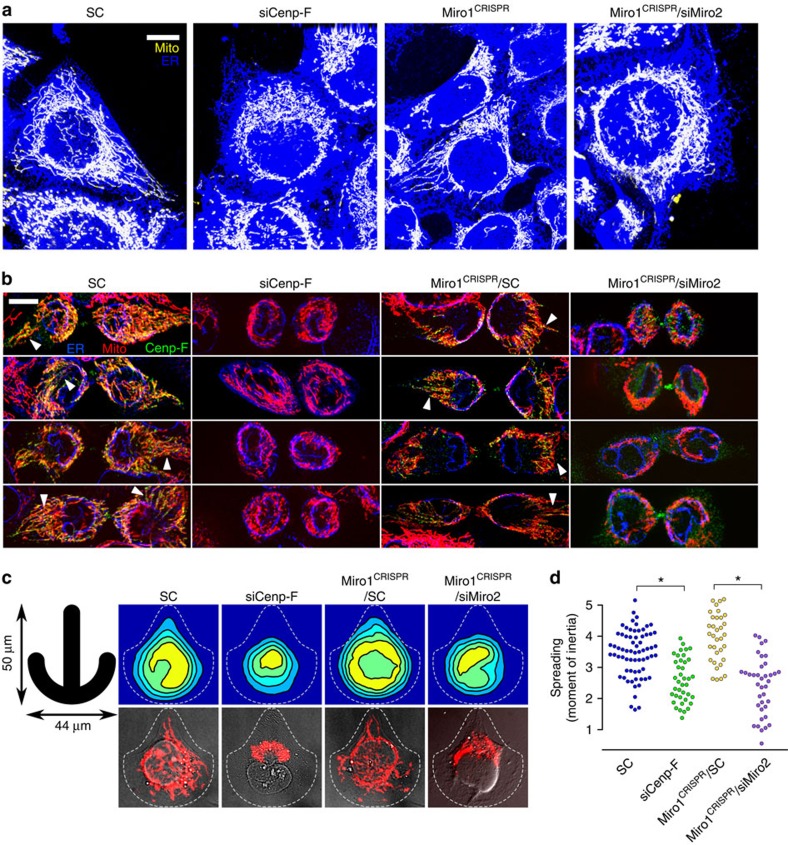
Figure 3. Miro and Cenp-F influence mitochondrial distribution.
(a) KERMIT cells of the indicated genotype with the indicated treatment, imaged both for mitochondria (mtBFP, yellow) and the ER (sec-61α-GFP, blue), which indicates cell boundaries. SC, scrambled siRNA. Scale bar, 10 μm. (b) Immunofluorescence of cytokinetic KERMIT cells with α-Cenp-F antibody. Arrowheads indicate bundles of parallel mitochondria. Scale bar, 10 μm. (c) Live KERMIT cells of the indicated genotype with the indicated treatment were seeded on crossbow-shaped micropatterns (left). Top: probability density maps of the position of the mitochondrial network. Bottom: example cells. The dashed line shows typical cell boundaries. (d) Measurement of the moment of inertia of the mitochondrial network of the cells in c. *P<10−5 from a Mann–Whitney–Wilcoxon U-test. The experiment has been repeated at least three times.

