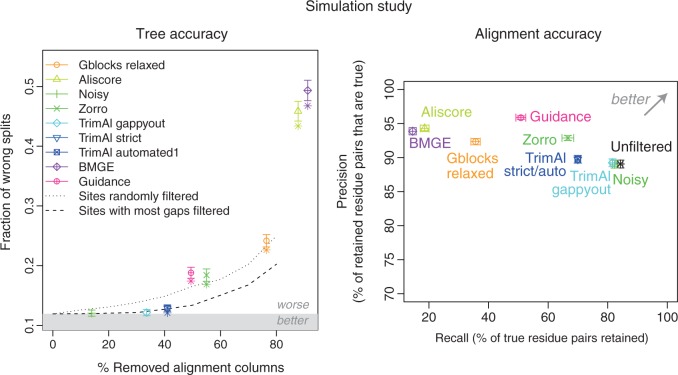
Figure 5.
Effect of alignment filtering on simulated data (500 alignments with 30 sequences each): induced tree and alignment accuracy. Tree accuracy (left): the measure of error is the average RF distance between the reference trees and trees reconstructed from Prank + F alignments filtered by the various approaches. Trees were reconstructed using PhyML. Filtered alignments improving over unfiltered alignment fall in the grey region. The two dotted lines correspond to results obtained with two simplistic filtering methods (see main text). Points correspond to default parameters. If a filtering method with default parameters yields significantly different (two-sided Wilcoxon test, ) results from unfiltered alignments, a star is displayed below the corresponding point. Error bars indicate the standard error of the mean. Alignment accuracy (right): precision and recall for the various filtering methods, using sum-of-pair scoring function (see section “Methods”).

