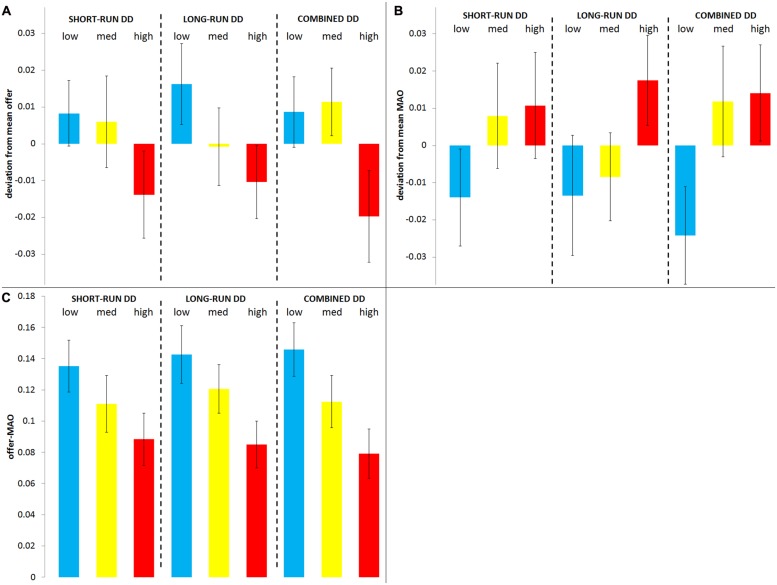
FIGURE 1.
Offer, minimum acceptable offer (MAO), and Offer-MAO by delay discounting (DD) groups. Mean (±robust SEM clustered by interviewer) offer (A), MAO (B), and offer-MAO (C) by groups of DD. Both offers and MAOs are plotted in terms of their deviation from the mean behavior. From left to right and separated by dashed lines, the short-run, long-run, and combined DD appear split in terciles (“low,” “med,” and “high” for the first, second, and third tercile, respectively).

