Abstract
We studied the effect of doxorubicin on the production of hydrogen peroxide by PC3 human prostate cancer cells, using a sensitive assay based on aminotriazole-mediated inhibition of catalase. PC3 cells exposed to increasing concentrations of doxorubicin had an increase in intracellular hydrogen peroxide that was concentration-dependent up to 1 μM doxorubicin. The apparent hydrogen peroxide concentration in the PC3 cells was 13 ± 4 pM under basal steady-state conditions and increased to 51 ± 13 pM after exposure to 1 μM doxorubicin for 30 min. The level of hydrogen peroxide in the medium as measured by Amplex Red did not increase as a result of doxorubicin treatment. PC3 cells overexpressing catalase were no more resistant to doxorubicin cytotoxicity as compared to non-transduced wild-type cells; therefore, the exact role of hydrogen peroxide in anthracycline cytotoxicity remains unproven. This study demonstrates that a specific oxidative event associated with the exposure of PC3 human prostate cancer cells to anthracyclines results in an increase in intracellular hydrogen peroxide.
Keywords: Hydrogen peroxide, Doxorubicin, PC3 cells, Catalase, Transduction, Amplex Red, Oxidative stress, Aminotriazole, Fluorescent probes, Reactive oxygen species
There are reports that suggest that anthracycline anti-cancer drugs may increase the intracellular production of hydrogen peroxide. The metabolic reductive activation of doxorubicin to a semiquinone (Eq. 1) stimulates production of superoxide by the one-electron reduction of oxygen (Eq. 2) [1]. The dismutation of the resulting superoxide, spontaneous or catalyzed by superoxide dismutase (SOD)1 enzymes, results in H2O2 (Eq. 3) that may be the species mediating doxorubicin cytotoxicity as shown below:
| (1) |
| (2) |
| (3) |
Studies of this issue on malignant cell lines have yielded conflicting results. Ubezio and Civoli [2] employed the oxidation-sensitive fluorescent probe dichlorofluorescin diacetate to detect reactive oxygen species (ROS) in cultured human colon cancer cells exposed to doxorubicin. They concluded that the fluorescence detected after drug exposure was likely due to H2O2, since preloading with catalase decreased the fluorescence. Gouaze et al. [3] found that glutathione peroxidase overexpression decreased ROS production by doxorubicin in cultured T47D breast cancer cells, suggesting that H2O2 might be involved. On the other hand, investigators using fluorescent probes found no evidence of H2O2 generation by ovarian carcinoma [4], or monocytic leukemia, unless preincubated with d,l-buthionine-S,R-sulfoxime to deplete glutathione [5]. In a cell free system, O'Malley et al. [6] found no evidence for direct oxidation of an oxidation-sensitive dye by three different anthracyclines including daunorubicin and doxorubicin even up to high concentrations of 50 μM.
Studies of non-malignant cells have also been contradictory. For example, Doroshow and Davies [7] studied beef heart submitochondrial particles and showed that anthracyclines stimulate the production of superoxide anion and hydroxyl radical. They also concluded from the effect of catalase on oxygen consumption, that H2O2 was being produced. In human red blood cells, anthracyclines were reported to generate ROS and using a catalase-aminotriazole trapping method concluded that this was in part H2O2 [8]. Kotamraju et al. [9] used myocytes and endothelial cells to show that both glutathione peroxidase mimetic and spin traps inhibit doxorubicin-induced apoptosis, and concluded that it was mediated by H2O2 generation. Kalivendi et al. [10] working on bovine aortic endothelial cells exposed to 0.5 μM doxorubicin found a 2- to 3-fold increase in fluorescence that decreased when pretreated with antioxidants. It is not known if this ROS was hydrogen peroxide. DeAtley et al. [11] using a related dye, dichlorodihydrofluorescein-diacetate (H2DCFDA), detected ROS after treatment of cardiomyocytes with doxorubicin, and there was a protective effect of antioxidants; however, no direct evidence was presented that the ROS detected was H2O2. Corna et al. [12] reported a 2- to 3-fold increase in fluorescence when cardiac myocytes were incubated with 5 μM doxorubicin; furthermore pretreatment with N-acetyl cysteine, a known ROS scavenger, inhibited the fluorescence. However, not all studies of non-malignant cells have agreed since Sawyer et al. [13], using fluorescent dye, found no evidence of H2O2 production by rat cardiac myocytes from another anthracycline, daunorubicin.
The situation is clouded by the fact that many of the studies that make conclusions about ROS and H2O2 formation use the oxidation of fluorescent dyes as an indicator. These oxidations do not necessarily indicate a specific oxidant, e.g., H2O2 [14]. In addition, O'Malley et al. [6] have shown that the generation of fluorescent products of some chromogenic probes can occur by their direct oxidation by redox-active compounds and not new ROS production. Furthermore, H2O2 is not kinetically competent to directly oxidize these dyes, but does so via a peroxidase-dependent process [15]. Rota et al. [16] have shown that dye fluorescence is mediated by the generation of a dichlorofluorescein radical in the presence, or even in the absence, of externally added H2O2, suggesting that application of this probe to measure cellular H2O2 may be problematic. We set about to answer the question whether H2O2 is formed when neo-plastic cells are exposed to anthracycline using PC3 prostate cancer cells. We have utilized three different analytical methods and two approaches to modulate catalase in cells to examine the role of H2O2. We chose doxorubicin as the anthracycline, since it is widely used in clinical oncology to treat solid tumors and hemato-logic malignancies and because it stimulates oxidative events.
Materials and methods
Cell culture
The human prostate cancer cell line, PC3, was obtained from the American Type Culture Collection (Manassas, VA). The cells were maintained in minimum essential media supplemented with 10% fetal bovine serum (FBS), l-glutamine (1.5 mM), penicillin (76 U/ml), and streptomycin (76 μg/ml) (Gibco Invitrogen, Grand Island, NY) in a humidified atmosphere containing 5% CO2 at 37 °C. Cells were passed before reaching confluence by detachment with trypsin/EDTA. Cells used in the experiments had been passed less than 20 times.
Intracellular hydrogen peroxide production assayed by aminotriazole-mediated inactivation of catalase method
Production of H2O2 can be estimated using a sensitive assay based on aminotriazole inhibition of catalase (EC1.11.1.6, H2O2: H2O2 oxidoreductase) [17,18]. Briefly, PC3 cells at 40–90% confluence in 100 mm (7854 mm2) tissue culture plates were placed in full media containing 10% FBS with 0–20 mM 3-aminotriazole (Sigma, St Louis, MO) at 37 °C. Dishes were rinsed two times at specified time points with ice-cold 50 mM phosphate buffered saline (PBS), pH 7.4 and then scrape-harvested into 1.0 ml of the same buffer, centrifuged at 300g, then 100–250 μl of 50 mM phosphate buffer pH 7 was added to the pellets and frozen at −20 °C. H2O2 concentration was calculated by kinetic analysis of the rate of decrease of catalase activity [18]. For catalase activity assays, the cell pellets were thawed rapidly [19] and then sonicated three times at 3 min per cycle in a Bransonic sonicator (Bransonic, Danbury, CT). Protein concentrations were estimated using 10 μl of the cell homogenates [20] using bovine serum albumin as a standard. Spectrophotometric catalase activities were run as described [21] using 100–400 μg/ml of homogenate cellular protein in phosphate buffer, pH 7.0. The assay was initiated by the addition of 500 μl of a 30 mM H2O2 stock solution in phosphate buffer, pH 7.0, and the loss of absorbance at 240 nm at 25 °C was monitored on a Beckman DU-600 UV–Vis spectrophotometer (Beckman–Coulter, Fullerton, CA). Initial catalase activities were calculated by fitting experimental data to the first order kinetics as described [21] and expressed as catalase k mU/mg cell protein. Catalase activity was also determined by native gel electrophoresis [22]. Gels were imaged and densitometric analyses were performed with a Digital Imaging and Analysis System (Alpha Innotech, San Leandro, CA).
Transduction of PC3 cells
The replication-defective recombinant type 5 adeno-virus containing human catalase DNA was used. Adenoviruses, AdCAT and AdLacZ, were constructed at The University of Iowa's Gene Transfer Vector Core by inserting human CAT cDNA or Escherichia coli lacZ cDNA into the E1 region of an Ad construct which has a deletion of the entire E1 and partial E3 regions, which renders the recombinant adenovirus replication-deficient [23–26]. The cDNAs are under the control of the human CMV promoter/enhancer.
Catalase transduction
PC3 cells at 10–40% confluence in 100 mm2 tissue culture plates were incubated for 48 h in the presence of 10– 200 MOI (multiplicity of infectivity) of the AdCAT vector. The amount of adenovirus to be added to plates was determined by detaching and counting replicate plates, and the amount of adenovirus calculated to achieve the desired MOI per cell based on the plaque forming units of the adenovirus construct. We tried two different transduction protocols: serum-free conditions from 1 to 24 h followed by recovery in full media with 10% FBS for an additional 24–47 h, or continuous adenovirus exposure for 48 h in full media with 10% FBS. Both transduction strategies resulted in similar catalase activity expression levels. Adenovirus MOI up to 200 resulted in no evidence of toxicity, changes in growth rate, or clonogenicity.
Extracellular hydrogen peroxide by Amplex Red assay
Extracellular H2O2 was determined using 10-acetyl-3,7-dihydroxyphenoxazine (Amplex Red reagent) [27,28] using the reagents and protocols provided in the Amplex Red Hydrogen Peroxide Assay Kit (Molecular Probes, Eugene, OR). Twenty-four hours prior to the experiment 25,000 PC3 cells/well were allowed to attach in 48-well culture plates. The next day, the media were removed and to each well was added 150 μl HBSS (Hanks’ buffered salt solution, Gibco Invitrogen). Two hundred microliters of the Amplex Red reaction mixture (100 μM Amplex Red, and 0.2 U/ml horseradish peroxidase in phosphate buffered saline, pH 7.4) was added to each well following a short incubation period at 37 °C. Then appropriate dilutions of doxorubicin or H2O2 standard were added at 50 μL per well in PBS pH 7.4. Amplex Red conversion to resorufin was measured at emission of 595 nm (excitation 485 nm) using a Tecan SPECTRAFlour Plus (Tecan Systems, San Jose, CA) plate reader. Readings were obtained before drug exposure, immediately after drug/H2O2 additions and at 15, 30, 45, and 60 min while incubating at 37 °C in the plate reader. Results are reported in resorufin arbitrary fluorescence units.
Fluorescent dye/flow cytometry analysis of ROS production
Intracellular production of ROS was measured using the fluorescent dye, 5- (and 6) carboxy-2′,7′-dichlorodi-hydrofluorescein-diacetate (carboxy-H2DCFDA) (C-400, Molecular Probes, Eugene, OR). Two days prior to experiments, 7.5 × 10⁵ cells were plated. Cells were then exposed to increasing concentrations of drug for 30 min. The time was chosen to give sufficient levels of drug uptake within a time frame in which ROS formation may be anticipated. The cells were detached with 0.25% trypsin and 0.11% EDTA for 10 min with drug present, then the cells were washed and resuspended in a 37 °C 10 mM glucose/HBSS (no phenol red, Ca2+, or Mg2+) solution. Then 1 × 10⁶ cells were labeled with carboxy-H2DCFDA for 15 min at 37 °C, placed on ice, filtered with a 70 μM Cell Strainer (BD Falcon, Bedford, MA), and analyzed using a FACScan flow cytometer (Becton–Dickinson Immunocytometry Systems, San Jose, CA) (488 nm excitation, 530 nm emission). The mean geometric fluorescence intensity for 10,000 cells was analyzed for each sample using CellQuest Pro software(BD Biosciences, San Jose, CA).
As a positive control for carboxy-H2DCFDA ROS detection, the following experiments were performed. The cells were detached with a trypsin/EDTA solution for 10 min and resuspended in 37 °C 10 mM glucose/HBSS (no phenol red, Ca2+, or Mg2+). Cells (1 × 10⁶) were labeled with carboxy-H2DCFDA for 15 min, and then increasing concentrations of H2O2 were added and incubation continued for an additional 5 min. The cells were placed on ice, filtered, and analyzed using a FACScan flow cytometer.
Clonogenic survival
Detached PC3 cells were counted with a Coulter Model Zf Cell Counter (Coulter Electronics, Hialeah, FL), and viability verified by hemocytometer in the presence of trypan blue. To 6-well (935 mm2) tissue culture plates were added 750 or 1000 viable cells in fresh media. The cultures were allowed to attach as single cells by incubating the cultures for 24 h. Clonogenic survival was then determined by incubating the cells in the presence of experimental compounds in full media with 10% FBS. At designated time points the media were removed, the cultures were rinsed with fresh media, and then new media were added without disturbing the cells.
Statistics
Student's t test was used for some comparisons. Two-way analysis of variance that included cell type and drug concentration was used to analyze the normalized data of the transduction experiments. Within the analysis, the weighted least squares method was used to adjust for the unequal variance among the groupings. Bonferroni's adjustment was used to control the experiment-wise error rate among the pairwise comparisons.
Results
Catalase transduction of PC3 cells
The constitutive level of catalase in the PC3 cell line was 8.8 ± 0.5 k mU/mg protein (n = 23 independent determinations) (3.0 ± 0.4 k mU/106 cells, n = 11). Transduction of PC3 cells increased catalase activity in a dose-dependent manner between 10 and 100 MOI Ad-CAT. At 150 and 200 MOI, we observed slight decreases in catalase activity as compared to at 100 MOI. For further studies we selected 100 MOI, as it provided maximal catalase activity of 24.6 ± 1.6 k mU/mg (n = 14) (7.6 ± 0.9 k mU/106 cells, n = 7) or a 3- to 4-fold increase without affecting cell growth characteristics or clonogenic efficiency.
Inhibition of PC3 catalase by aminotriazole
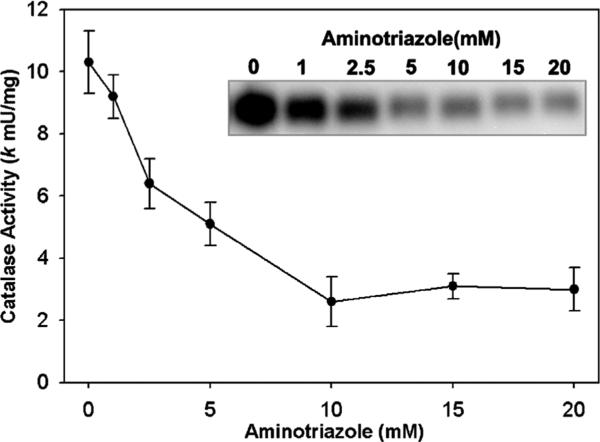
We utilized a method for measuring intracellular H2O2 production based on the reaction of H2O2 with catalase in the presence of aminotriazole [29]. The method is specific, since only H2O2 converts catalase to compound I, and compound I reacts with aminotriazole forming an irreversibly inactive catalase [29]. Therefore, by measuring the extent of catalase inhibition by amino-triazole, one can kinetically estimate the intracellular steady-state concentration of H2O2. We first confirmed the effect of aminotriazole concentration on PC3 cellular endogenous catalase activity in our system. As can be seen in Fig. 1, there was a concentration-dependent inhibition of catalase activity. With 5 mM aminotriazole there was approximately 50% inhibition of catalase activity, while with 10 mM aminotriazole the enzyme had been inhibited by 75%. Fig. 1 (inset) shows the inhibition as determined by catalase activity gel assays, and this confirms the spectrophotometric assay. We used this data to choose the aminotriazole concentrations in subsequent studies.
Fig. 1.
Inhibition of intracellular catalase activity by 3-aminotriazole in PC3 cells. PC3 cells were incubated for 2 h with aminotriazole in MEM media with 10% FBS at 37 °C. Cells were rinsed and scrape-harvested into 50 mM phosphate buffer, pH 7.0. Catalase activity was determined by the spectrophotometric catalase assay using 400 μg total cellular protein. Shown is the mean ± SEM of three experiments. Inset: in a complementary method, catalase activity was analyzed by activity gels loaded at 25 μg of PC3 protein per well and stained for catalase activity by the Prussian blue deposition method. Shown is an inverse black/white image of a representative gel.
Effect of doxorubicin on intracellular hydrogen peroxide generation
We next used the aminotriazole inhibition of catalase method to determine the effect of doxorubicin on intra-cellular H2O2 production in PC3 cells overexpressing catalase. We chose to use catalase overexpressing (adenovirus-mediated) cells for these studies, to increase the range of catalase activity that can be followed over time in the presence of aminotriazole and to increase the likelihood of detecting H2O2. At 15 min there was a higher intracellular [H2O2] in those cells exposed to 1 μM doxorubicin (22.1 ± 6.0 pM) as compared to those not exposed (9.7 ± 2.7 pM, n = 5, p = 0.04, paired t test). Both the spectrophotometric and catalase activity gel assays demonstrated this trend, and we used this time point (15 min) for the doxorubicin concentration study. At later time points up to 120 min, the rate of catalase inhibition became non-linear.
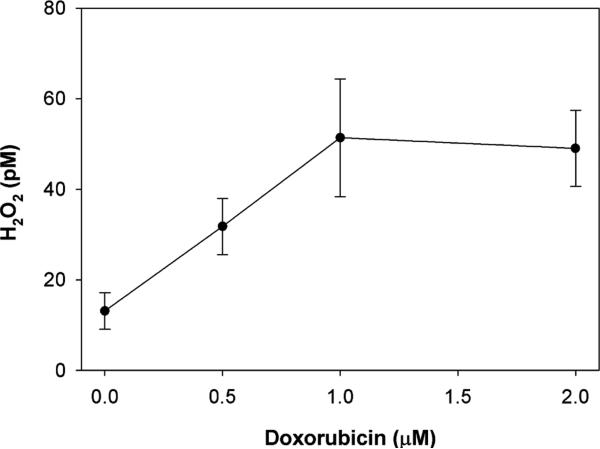
We next studied the drug concentration-dependence on H2O2 production. PC3 cells overexpressing catalase were incubated for 15 min with increasing concentrations of doxorubicin in the presence of aminotriazole and the intracellular H2O2 determined. Although our method determines the flux of H2O2 through catalase inhibition, this is indicative of H2O2 concentration. As can be seen in Fig. 2, there was a significant increase in the steady-state level of intracellular H2O2 up to 1 μM doxorubicin concentration, above which the H2O2 level plateaued. This increase was confirmed by H2O2 concentrations as determined by catalase activity gel assays, but the absolute values of H2O2 were lower.
Fig. 2.
Effect of doxorubicin on intracellular H2O2 concentration in PC3 cells. PC3 cells overexpressing catalase (transduced with catalase 100 MOI) were incubated with doxorubicin for 15 min in the presence of aminotriazole. Aminotriazole-mediated inhibition of catalase activity was used to estimate intracellular H2O2. Shown is the mean and SEM of three independent experiments.
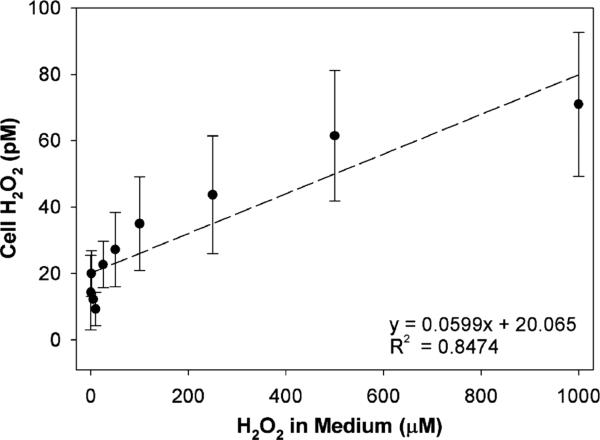
In the next series of experiments, we examined whether extracellular H2O2 may contribute to catalase inhibition in PC3 cells. For this purpose, increasing concentrations of H2O2 (0–1 mM) were added to a medium containing aminotriazole and cells, then after a 15 min incubation, catalase activity was determined. Extracellular H2O2 decreased cellular catalase activity in a dose-dependent manner (6% at 5 μM, 11% at 10 μM, 12% at 50 μM, 46% at 100 μM, 52% at 250 μM, and 70% at 1000 μM H2O2). We also determined the level of intra-cellular H2O2 as a function of H2O2 added to the medium (Fig. 3). There was a linear positive relationship; however, the concentrations were six-orders of magnitude lower inside the cell as compared to those in the medium. This demonstrates that H2O2 can be detected by our cellular PC3 assay system even when the increment in intracellular concentrations is small.
Fig. 3.
Detection of intracellular H2O2 in PC3 cells treated with extracellular H2O2. H2O2 was added to the medium in the presence of aminotriazole for 15 min. Cellular H2O2 concentration was determined by the aminotriazole-mediated inhibition of catalase assay. Five separate, closely agreeing experiments with PC3 cells were combined. Three of these used PC3 cells transduced with AdCAT (100 MOI, 48 h) and two without catalase transduction.
Lack of increase in extracellular hydrogen peroxide by doxorubicin, as determined using Amplex Red assay
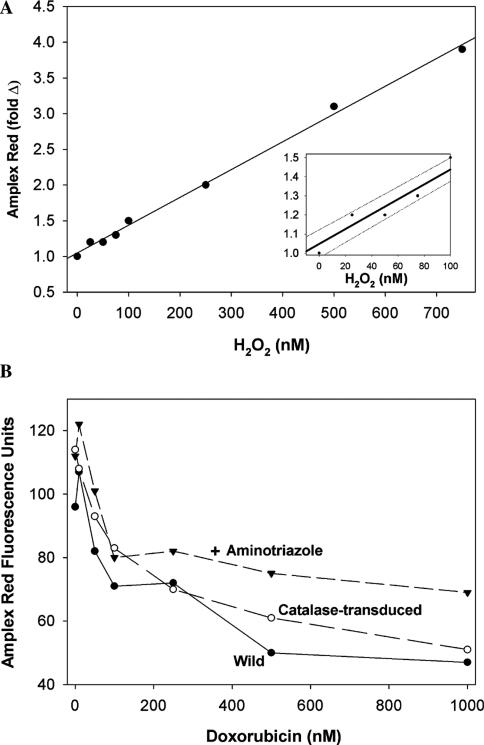
We next determined if extracellular H2O2 accumulates in the media of cells after exposure to doxorubicin. Any H2O2 produced intracellularly that diffuses out of the cells or produced locally at the plasma membrane would be detected by using the highly sensitive Amplex Red assay. Fig. 4A shows the standard curve and illustrates that the assay is sensitive in the low nm range for H2O2. Fig. 4B shows the results of studies with wild PC3 cells treated with increasing concentrations of doxorubicin. Although fluorescence could be detected in the media of untreated cells, indicating the natural production of H2O2 (basal level), incubations with the drug yielded a less intense fluorescence, suggesting that doxorubicin not only failed to stimulate H2O2 production, but that it rather suppressed the natural production of H2O2. Identical studies on PC3 cells overexpressing catalase and cells exposed to aminotriazole gave similar results (Fig. 4B).
Fig. 4.
(A) H2O2 standard curve for the 10-acetyl-3,7-dihydroxyphenoxazine (Amplex Red) hydrogen peroxide assay. (B) Doxorubicin does not increase extracellular H2O2 as measured by Amplex Red hydrogen peroxide assay. Amplex Red was added to PC3 cells (labeled wild) in 48-well plates, and after 5 min, doxorubicin was added and fluorescence at 485 nm excitation and 595 nm emission were read at various times. The corrected fluorescence at 60 min is presented (readings at 15, 30, and 45 min gave proportionally lower fluorescence, but the same pattern was observed). Also shown are studies on PC3 cells preincubated with 10 mM aminotriazole for 2 h to inhibit constitutive catalase, and PC3 cells transduced with replication-defective recombinant type-5 adenovirus containing human catalase DNA (100 MOI). Values are corrected for doxorubicin autofluorescence by subtracting fluorescence units measured 1 min after the addition of doxorubicin. This autofluorescence became significant only at higher concentrations of doxorubicin. Amplex Red-derived fluorescence is in arbitrary units. Inset shows the lower concentrations.
Because the low fluorescence observed in the presence of doxorubicin could be due to quenching of resorufin-excited singlet state by the drug, we attempted to examine this effect in a cell-free system. Using resorufin (500 nM), we found no evidence of fluorescence quenching by 1 μM doxorubicin (the highest concentration of the drug used in our cell work) alone, or in the presence of H2O2 and horseradish peroxidase (not shown). Furthermore, in time-course experiments using PC3 cells treated with Amplex Red, the addition of doxorubicin (1 μM) at eight time intervals between 0 and 60 min showed no quenching of fluorescence from in situ generated resorufin even when monitored for 60 min after the addition of doxorubicin. These experiments make quenching artifact and oxidation of resorufin to a nonfluorescing product (likely to occur in the presence of an excess of H2O2), unlikely explanations for the decline in fluorescence in Fig. 4B.
Lack of effect of doxorubicin on intracellular oxidation-sensitive dye fluorescence
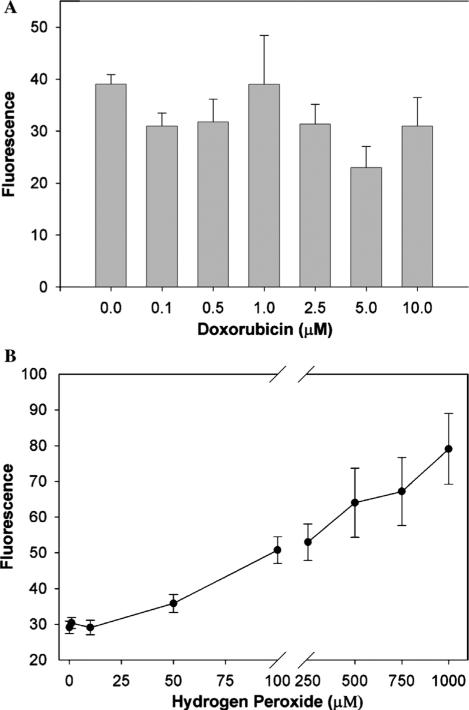
We next examined the effect of doxorubicin on carboxy-H2DCFDA fluorescence of PC3 cells exposed to increasing concentrations of doxorubicin. The fluorescense at the various concentrations of doxorubicin (Fig. 5A) was not significantly different by one-way ANOVA (p = 0.322). When cells were trypsinized and then exposed to doxorubicin, reverse order of addition as depicted in Fig. 5A, similar results were observed. These negative results may be the consequence of low sensitivity of the probe and also of relatively high background fluorescence.
Fig. 5.
(A) Doxorubicin had no effect on carboxy-H2DCFDA fluorescence of human prostate cancer cells. PC3 prostate cancer cells (7.5 × 10⁵) were exposed to increasing concentrations of doxorubicin for 30 min, and 0.25% trypsin and 0.11% EDTA were added during the last 10 min to detach the cells. Carboxy-H2DCFDA was then added for 15 min, fluorescence read on a FACScan flow cytometer (488 nm excitation, 530 nm emission) and corrected for fluorescence contributions by doxorubicin. Shown is geometric mean fluorescence, and values are the mean and SEM of four separate experiments. There was no significant difference by one-way ANOVA (p = 0.3). (B) Carboxy-H2DCFDA fluorescence increases as PC3 cells are exposed to externally applied H2O2. PC3 cells were detached, exposed to carboxy-H2DCFDA for 15 min, and then the desired H2O2 concentrations for 5 min. Carboxy-H2DCFDA fluorescence was measured by flow cytometry. Shown is geometric mean fluorescence, and the data represents the means (±SEM) for three independent determinations. The H2O2 concentrations were significantly different (p < 0.0001) by one-way analysis of variance.
Doxorubicin alone fluoresces at concentrations above 5 μM. To control for this fluorescence, PC3 cells exposed to 5 and 10 μM doxorubicin in the absence of carboxy-H2DCFDA, were analyzed and the fluorescence contribution of the drug subtracted from the samples containing carboxy-H2DCFDA.
Detectable effect of external H2O2 on intracellular oxidation-sensitive dye fluorescence
To validate our method for the detection of intracellular ROS by the carboxy-H2DCFDA fluorescence assay say, we exposed PC3 cells to external H2O2. With increasing concentrations of externally applied H2O2 (0–1 mM), we detected increased cell fluorescence from the dye (Fig. 5B). By one-way ANOVA, the changes in fluorescence were significant (p < 0.0001). This demonstrates that extracellular H2O2 induces increments in intracellular H2O2 level, and that these increments can be detected by the probe. There was no difference between determinations when the order of addition of H2O2 and carboxy-H2DCFDA was reversed. Others have reported similar results with external H2O2. For example, Lorenz et al. [30] added 100 μM H2O2 to astroglial cell cultures and found increased probe fluorescence.
Lack of effect of catalase modulation (both overexpression and inhibition) on doxorubicin toxicity by clonogenic survival
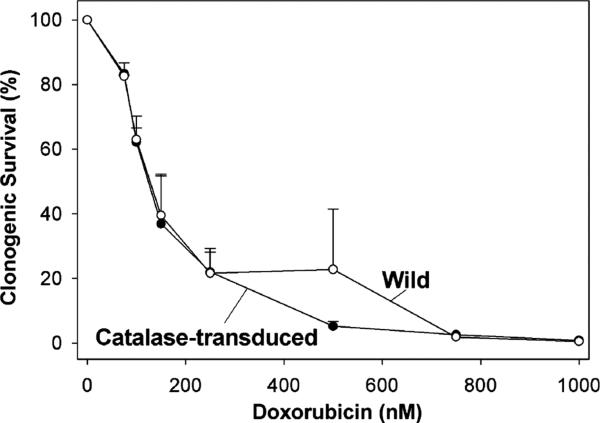
If H2O2 were to be generated in response to doxorubicin exposure and if it mediates in part the toxicity of the drug, then overexpression of catalase should decrease drug toxicity. PC3 cells transduced with catalase were exposed to doxorubicin at 0–1000 nM for 1 h. Fig. 6 shows that there was no difference in clonogenic survival between control PC3 cells and PC3 cells transduced with catalase (100 MOI), since both had 50% survival around 150 nM doxorubicin. Both the control and transduced PC3 cells had similar clonogenic efficiencies.
Fig. 6.
Clonogenic survival of catalase transduced cells treated with doxorubicin. PC3 cells were transduced for 24 h with 100 MOI AdCAT. Cells were then detached, counted, and incubated for 24 h to recover and reattach as single cells. Cells were then exposed to doxorubicin for 1 h at 37 °C. The media and drug were removed, rinsed with fresh media, and incubated for 7–10 days in fresh media. Clonogenic survival was determined from fixed and stained culture plates. Clonogenic survival is expressed as a percentage of respective control not exposed to doxorubicin. Values are the mean survival (±SEM) from three independent experiments. Transduction of PC3 cells with 100 MOI AdCAT did not affect cloning efficiency of cells not exposed to doxorubicin (transduced cells 14.3 ± 3.1% vs. wild cells 17.8 ± 6.1%).
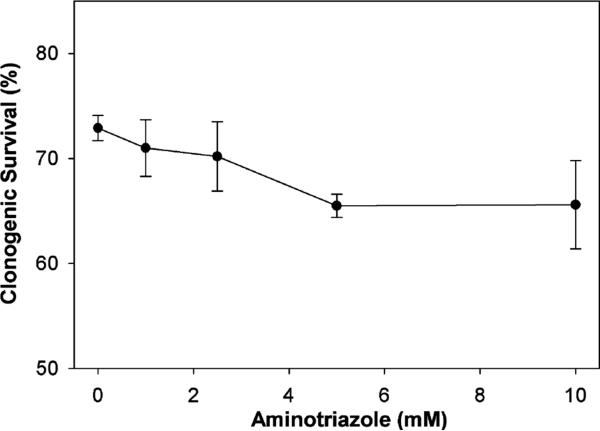
We next carried out the converse experiment and studied the effect of catalase inhibition on doxorubicin sensitivity. PC3 cells were exposed to varied concentrations of aminotriazole, similar to those used in Fig. 3, resulting in catalase activity levels ranging from 30 to 100% of the initial endogenous catalase activity. Fig. 7 shows that inhibition of catalase activity by aminotriazole at increasing concentrations had no appreciable effect on sensitivity of PC3 cells to doxorubicin in a clonogenic survival assay.
Fig. 7.
Effect of aminotriazole on clonogenic survival of PC3 cells exposed to doxorubicin. PC3 cells, which had been trypsinized, counted, and allowed to reattach as single cells, were treated with aminotriazole for 2 h, then doxorubicin 100 nM was added. After an additional 1 h, the drug-containing media were removed, cells rinsed, and new media were added. Cultures were incubated for 7–10 days before fixation, staining, and counting. Survival was determined from viable colonies and expressed as percent relative to no-treatment controls. The value for control cells not exposed to doxorubicin or aminotriazole was 100%. Values are the mean percents (±SEM) from three independent experiments.
Discussion
Using a sensitive assay based on aminotriazole-mediated inhibition of catalase, we were able to detect a 4-fold increase in the steady-state level of intracellular H2O2 when human prostate cancer cells were exposed to the anthracycline doxorubicin. This increase occurred within 15 min and appeared to be doxorubicin concentration-dependent up to about 1 μM. We could not determine whether the increment in intracellular H2O2 concentration was due to the direct generation of H2O2 as a result of drug metabolism, or a drug-induced perturbation of cellular redox status causing an apparent increase in intracellular H2O2.
We used a sensitive method for the measurement of intracellular [H2O2] based on irreversible inhibition of catalase by aminotriazole [31]. This enzyme catalyzes the dismutation of H2O2 to innocuous products (2H2O2 → O2 + 2H2O). Catalase inhibition by aminotriazole requires H2O2 that reacts with the enzyme's heme and converts it to catalase compound I. Aminotriazole forms a covalent bond with catalase compound I rendering it inactive. Therefore, the extent of catalase inhibition in the presence of aminotriazole is dependent on the initial [H2O2]; since the reaction is typically described by a pseudo-first order kinetics, the rate of catalase inhibition by aminotriazole can be used to estimate [H2O2] within cells. This approach has been used previously in PC3 cells [32] and other cell systems [18,33] and is a more specific estimate of cellular [H2O2] than fluorescence-based assays using non-specific dye indicators such as H2DCFDA. It is known that certain other drugs increase [H2O2] in isolated rat hepatocytes as measured by the irreversible inhibition of catalase by aminotriazole, e.g., diquat and glycolate [34]. Through the use of this method, we sought to determine if [H2O2] increases in cells exposed to anthracyclines.
Generation of H2O2 is a normal physiologic process in the cytosol and several intracellular organelles [29]. We estimate that in the PC3 cell, the basal, steady-state level of H2O2 is 13.1 ± 4.0 pM. Our value is higher than the 4.4 pM intracellular steady-state level reported by Ahmad et al. [32] using a similar method. Because catalase is localized in peroxisomes, changes in catalase activity due to aminotriazole reflect localized steady-state concentrations of H2O2 in or accessible to the peroxisome. Therefore, the steady-state concentrations at other sub-cellular sites are probably somewhat higher [35].
We complemented the measurement of cellular H2O2 with determination of [H2O2] in the medium and surprisingly found no drug-induced increment. Amplex Red provides a sensitive assay for H2O2 [27,28]. However, since the indicator enters the cells poorly, it measures only extracellular H2O2. H2O2 is a small uncharged molecule, and since it can diffuse readily through organelle membranes [35], one might anticipate that equilibrium between intracellular and extracellular concentrations would be reached, and the measurement of H2O2 in culture media would reflect intracellular concentration. In this regard, we showed that externally provided H2O2 could facilitate aminotriazole-dependent inhibition of catalase intracellularly, suggesting that there is an exchange of H2O2 between the environment and the cells. Therefore, an increase in H2O2 generated intracellularly, or in proximity to the plasma membrane as a result of anthracycline exposure, should have been detected by our Amplex Red method if the peroxide diffuses out of the cell and reaches sufficient concentrations in the media. However, the intracellular increment was not paralleled by an increase extracellularly. This may be due to a lack of transmembrane equilibration of H2O2 or more likely its reaction with intracellular sinks. Alternatively, the Amplex Red assay may have failed to detect a small increase due to lack of sensitivity. This seems to be a highly likely explanation since the intracellular pM levels of H2O2 may not be sufficient to increase extracellular H2O2 to nM levels necessary for its detection by this assay. Excess H2O2 in the presence of peroxidase can quench resorufin fluorescence by forming non-fluorescent products [36] (Reszka et al., in preparation); however, this possibility was excluded by control experiments. Towne et al.[36] have defined the experimental conditions that can lead to falsely low values. According to their observations, the possibility of falsely low values in our experiments is minimized based on the experimental pH we used, early time points measured, and the very low concentrations of H2O2 expected. In our study, the Amplex Red data (Fig. 4B) suggest the possibility that the naturally present extracellular H2O2 may actually decrease when the cells are exposed to higher concentrations of doxorubicin. This could be due to drug cytotoxicity.
Externally added H2O2 has access to peroxisomes in PC3 cells (Fig. 3); however, the ratio of extracellular to intracellular H2O2 was determined to be of the order of 106. This could be because intracellular antioxidants or other peroxide sinks may remove most of it.
We found that the wild-type human prostate cancer cell line PC3 contains catalase activity at 8.8 ± 0.5 k mU/mg protein (n = 23). This is similar to the value reported earlier for PC3 cells of 7 k mU/mg [37]. Others have reported somewhat higher values [38]. Therefore, our levels are similar to previous reports, taking into account the kinetic calculations and small differences in the methods of cell handling. With catalase transduction (100 MOI), our cells increased their catalase to about 24.6 ± 1.6 k mU/mg (n = 14), or almost 3-fold, with no apparent toxic effect.
There was no effect of catalase modulation on doxorubicin sensitivity in cytotoxic assays. We showed both that the cytotoxicity of doxorubicin is not altered by overexpression of cellular catalase, or conversely by lowering the cellular catalase activity by the addition of an inhibitor of the catalase. These experiments, which modulated catalase activity, suggest that catalase alone does not appear to play a pivotal role in protecting PC3 cells from doxorubicin exposure, and that the redox event associated with the drug is more complex. Similarly, it has been observed that aminotriazole inhibition of catalase did not alter epirubicin-cytotoxicity in a major way for the M38K mesothelioma cell line [39].
The way by which anthracyclines provide their anti-neoplastic properties is not totally clarified. The generally discussed mechanisms are based on topoisomerase inhibition [40], drug intercalation into DNA [41–43] and membrane interaction [44–46]. Alternatively, oxidative mechanisms of anthracycline cytotoxicity have been proposed. Some of this latter work have been in cardiac myocytes, but there is also evidence in neoplastic cells. Anthracyclines can generate free radicals [1,7,47–49]. Anthracyclines may be reduced by enzymes in mitochondria [7,50] or microsomes [51] to generate anthracycline semiquinone radicals. These semiquinones can then reduce O2 to O2•− with concomitant regeneration of the parent anthracyclines, establishing a redox cycle. Dismutation of O2•− produces H2O2 by enzymatic and non-enzymatic means that can cause oxidative damage to DNA, protein, or lipids and depletion of critical cellular antioxidants. Cellular damage could be by hydroxyl radicals generated via Fenton chemistry or the formation of peroxynitrite (ONOO− ) [52]. Our detection of an increment in H2O2 when cancer cells are exposed to doxorubicin demonstrates that a specific oxidative event is associated with anthracycline exposure.
Acknowledgments
This investigation was supported by Grants P01 CA66081 awarded by the National Cancer Institute, Department of Health and Human Services, Heartland Affiliate of the American Heart Association (K.J.R.), The Iowa Leukemia and Cancer Research Fund, The Dr. Richard O. Emmons Memorial Fund, and The Mamie C. Hopkins Fund. The Antioxidant Enzyme Core Laboratory and the Electron Spin Resonance Core Laboratory are supported by P01 CA66081. We thank Dr. Justine Ritchie of The University of Iowa College of Public Health for calculation of the two-way analysis of variance, The University of Iowa Gene Transfer Vector Core for providing the AdCAT for these studies, The Antioxidant Enzyme Core Laboratory for assistance with the catalase assays, Sean Martin of the Electron Spin Resonance Core Laboratory for help with the nitrite determinations, and Drs. Douglas Spitz and Larry Oberley for helpful discussions.
Footnotes
Abbreviations used: SOD, superoxide dismutase; ROS, reactive oxygen species; FBS, fetal bovine serum; PBS, phosphate buffered saline; MOI, multiplicity of infectivity; HBSS, Hanks' buffered salt solution; carboxy-H2DCFDA, 5- (and 6) carboxy-2′,7′-dichlorodihydrofluorescein-diacetate.
References
- 1.Kalyanaraman B, Sealy RC, Sinha BK. Biochim. Biophys. Acta. 1984;799:270–275. doi: 10.1016/0304-4165(84)90270-8. [DOI] [PubMed] [Google Scholar]
- 2.Ubezio P, Civoli F. Free Radic. Biol. Med. 1994;16:509–516. doi: 10.1016/0891-5849(94)90129-5. [DOI] [PubMed] [Google Scholar]
- 3.Gouaze V, Mirault ME, Carpentier S, Salvayre R, Levade T, Andrieu-Abadie N. Mol. Pharmacol. 2001;60:488–496. [PubMed] [Google Scholar]
- 4.Wang S, Konorev EA, Kotamraju S, Joseph J, Kalivendi S, Kalyanaraman B. J. Biol. Chem. 2004;279:25535–25543. doi: 10.1074/jbc.M400944200. [DOI] [PubMed] [Google Scholar]
- 5.Mansat-de Mas V, Bezombes C, Quillet-Mary A, Bettaieb A, D'Orgeix D, Laurent G, Jaffrezou JP. Mol. Pharmacol. 1999;56:867–874. doi: 10.1124/mol.56.5.867. [DOI] [PubMed] [Google Scholar]
- 6.O'Malley YQ, Reszka KJ, Britigan BE. Free Radic. Biol. Med. 2004;36:90–100. doi: 10.1016/j.freeradbiomed.2003.09.021. [DOI] [PubMed] [Google Scholar]
- 7.Doroshow JH, Davies KJ. J. Biol. Chem. 1986;261:3068–3074. [PubMed] [Google Scholar]
- 8.Henderson CA, Metz EN, Balcerzak SP, Sagone AL., Jr Blood. 1978;52:878–885. [PubMed] [Google Scholar]
- 9.Kotamraju S, Konorev EA, Joseph J, Kalyanaraman B. J. Biol. Chem. 2000;275:33585–33592. doi: 10.1074/jbc.M003890200. [DOI] [PubMed] [Google Scholar]
- 10.Kalivendi SV, Kotamraju S, Zhao H, Joseph J, Kalyanaraman B. J. Biol. Chem. 2001;276:47266–47276. doi: 10.1074/jbc.M106829200. [DOI] [PubMed] [Google Scholar]
- 11.DeAtley SM, Aksenov MY, Aksenova MV, Harris B, Hadley R, Cole Harper P, Carney JM, Butterfield DA. Cancer Lett. 1999;136:41–46. doi: 10.1016/s0304-3835(98)00306-1. [DOI] [PubMed] [Google Scholar]
- 12.Corna G, Santambrogio P, Minotti G, Cairo G. J. Biol. Chem. 2004;279:13738–13745. doi: 10.1074/jbc.M310106200. [DOI] [PubMed] [Google Scholar]
- 13.Sawyer DB, Fukazawa R, Arstall MA, Kelly RA. Circ. Res. 1999;84:257–265. doi: 10.1161/01.res.84.3.257. [DOI] [PubMed] [Google Scholar]
- 14.Hempel SL, Buettner GR, O'Malley YQ, Wessels DA, Flaherty DM. Free Radic. Biol. Med. 1999;27:146–159. doi: 10.1016/s0891-5849(99)00061-1. [DOI] [PubMed] [Google Scholar]
- 15.Royall JA, Ischiropoulos H. Arch. Biochem. Biophys. 1993;302:348–355. doi: 10.1006/abbi.1993.1222. [DOI] [PubMed] [Google Scholar]
- 16.Rota C, Chignell CF, Mason RP. Free Radic. Biol. Med. 1999;27:873–881. doi: 10.1016/s0891-5849(99)00137-9. [DOI] [PubMed] [Google Scholar]
- 17.Yusa T, Beckman JS, Crapo JD, Freeman BA. J. Appl. Physiol. 1987;63:353–358. doi: 10.1152/jappl.1987.63.1.353. [DOI] [PubMed] [Google Scholar]
- 18.Royall JA, Gwin PD, Parks DA, Freeman BA. Arch. Biochem. Biophys. 1992;294:686–694. doi: 10.1016/0003-9861(92)90742-f. [DOI] [PubMed] [Google Scholar]
- 19.Cao E, Chen Y, Cui Z, Foster PR. Biotechnol. Bioeng. 2003;82:684–690. doi: 10.1002/bit.10612. [DOI] [PubMed] [Google Scholar]
- 20.Hess HH, Lees MB, Derr JE. Anal. Biochem. 1978;85:295–300. doi: 10.1016/0003-2697(78)90304-4. [DOI] [PubMed] [Google Scholar]
- 21.Aebi H. Methods Enzymol. 1984;105:121–126. doi: 10.1016/s0076-6879(84)05016-3. [DOI] [PubMed] [Google Scholar]
- 22.Sun Y, Elwell JH, Oberley LW. Free Radic. Res. Commun. 1988;5:67–75. doi: 10.3109/10715768809066913. [DOI] [PubMed] [Google Scholar]
- 23.Chu Y, Heistad DD. Methods Enzymol. 2002;346:263–276. doi: 10.1016/s0076-6879(02)46060-0. [DOI] [PubMed] [Google Scholar]
- 24.Anderson RD, Haskell RE, Xia H, Roessler BJ, Davidson BL. Gene Ther. 2000;7:1034–1038. doi: 10.1038/sj.gt.3301197. [DOI] [PubMed] [Google Scholar]
- 25.Wang Q, Finer MH. Nat. Med. 1996;2:714–716. doi: 10.1038/nm0696-714. [DOI] [PubMed] [Google Scholar]
- 26.Li Q, Sanlioglu S, Li S, Ritchie T, Oberley L, Engelhardt JF. Antioxid. Redox Signal. 2001;3:415–432. doi: 10.1089/15230860152409068. [DOI] [PubMed] [Google Scholar]
- 27.Mohanty JG, Jaffe JS, Schulman ES, Raible DG, Immunol J. Methods. 1997;202:133–141. doi: 10.1016/s0022-1759(96)00244-x. [DOI] [PubMed] [Google Scholar]
- 28.Zhou M, Diwu Z, Panchuk-Voloshina N, Haugland RP. Anal. Biochem. 1997;253:162–168. doi: 10.1006/abio.1997.2391. [DOI] [PubMed] [Google Scholar]
- 29.Chance B, Sies H, Boveris A. Physiol. Rev. 1979;59:527–605. doi: 10.1152/physrev.1979.59.3.527. [DOI] [PubMed] [Google Scholar]
- 30.Lorenz P, Roychowdhury S, Engelmann M, Wolf G, Horn TF. Nitric Oxide. 2003;9:64–76. doi: 10.1016/j.niox.2003.09.005. [DOI] [PubMed] [Google Scholar]
- 31.Margoliash E, Novogrodsky A, Schejter A. Biochem. J. 1960;74:339–348. doi: 10.1042/bj0740339. [DOI] [PMC free article] [PubMed] [Google Scholar]
- 32.Ahmad IM, Aykin-Burns N, Sim JE, Walsh SA, Higashikubo R, Buettner GR, Venkataraman S, Mackey MA, Flanagan SW, Oberley LW, Spitz DR. J. Biol. Chem. 2005;280:4254–4263. doi: 10.1074/jbc.M411662200. [DOI] [PubMed] [Google Scholar]
- 33.Paler-Martinez A, Panus PC, Chumley PH, Ryan U, Hardy MM, Freeman BA. Arch. Biochem. Biophys. 1994;311:79–85. doi: 10.1006/abbi.1994.1211. [DOI] [PubMed] [Google Scholar]
- 34.Boutin JA, Kass GE, Moldeus P. Toxicology. 1989;54:129–137. doi: 10.1016/0300-483x(89)90039-5. [DOI] [PubMed] [Google Scholar]
- 35.Antunes F, Cadenas E. FEBS Lett. 2000;475:121–126. doi: 10.1016/s0014-5793(00)01638-0. [DOI] [PubMed] [Google Scholar]
- 36.Towne V, Will M, Oswald B, Zhao Q. Anal. Biochem. 2004;334:290–296. doi: 10.1016/j.ab.2004.07.037. [DOI] [PubMed] [Google Scholar]
- 37.Venkataraman S, Jiang X, Weydert C, Zhang Y, Zhang HJ, Goswami PC, Ritchie JM, Oberley LW, Buettner GR. Oncogene. 2005;24:77–89. doi: 10.1038/sj.onc.1208145. [DOI] [PubMed] [Google Scholar]
- 38.Jung K, Seidel B, Rudolph B, Lein M, Cronauer MV, Henke W, Hampel G, Schnorr D, Loening SA. Free Radic. Biol. Med. 1997;23:127–133. doi: 10.1016/s0891-5849(96)00613-2. [DOI] [PubMed] [Google Scholar]
- 39.Kahlos K, Soini Y, Sormunen R, Kaarteenaho-Wiik R, Paakko P, Linnainmaa K, Kinnula VL. Cancer. 2001;91:1349–1357. doi: 10.1002/1097-0142(20010401)91:7<1349::aid-cncr1138>3.0.co;2-d. [DOI] [PubMed] [Google Scholar]
- 40.Liu LF. Annu. Rev. Biochem. 1989;58:351–375. doi: 10.1146/annurev.bi.58.070189.002031. [DOI] [PubMed] [Google Scholar]
- 41.Baguley BC. Anticancer Drug Des. 1991;6:1–35. [PubMed] [Google Scholar]
- 42.Denny WA. Anticancer Drug Des. 1989;4:241–263. [PubMed] [Google Scholar]
- 43.Quigley GJ, Wang AH, Ughetto G, van der Marel G, van Boom JH, Rich A. Proc. Natl. Acad. Sci. USA. 1980;77:7204–7208. doi: 10.1073/pnas.77.12.7204. [DOI] [PMC free article] [PubMed] [Google Scholar]
- 44.Siegfried JA, Kennedy KA, Sartorelli AC, Tritton TR. J. Biol. Chem. 1983;258:339–343. [PubMed] [Google Scholar]
- 45.Hickman JA, Chahwala SB, Thompson MG. Adv. Enzyme Regul. 1985;24:263–274. doi: 10.1016/0065-2571(85)90081-0. [DOI] [PubMed] [Google Scholar]
- 46.Triton TR, Yee G. Science. 1982;217:248–250. doi: 10.1126/science.7089561. [DOI] [PubMed] [Google Scholar]
- 47.Sinha BK, Katki AG, Batist G, Cowan KH, Myers CE. Biochemistry. 1987;26:3776–3781. doi: 10.1021/bi00387a006. [DOI] [PubMed] [Google Scholar]
- 48.Muindi JR, Sinha BK, Gianni L, Myers CE. FEBS Lett. 1984;172:226–230. doi: 10.1016/0014-5793(84)81130-8. [DOI] [PubMed] [Google Scholar]
- 49.Sinha BK, Mimnaugh EG. Free Radic. Biol. Med. 1990;8:567–581. doi: 10.1016/0891-5849(90)90155-c. [DOI] [PubMed] [Google Scholar]
- 50.Davies KJ, Doroshow JH. J. Biol. Chem. 1986;261:3060–3067. [PubMed] [Google Scholar]
- 51.Mimnaugh EG, Gram TE, Trush MA. J. Pharmacol. Exp. Ther. 1983;226:806–816. [PubMed] [Google Scholar]
- 52.Beckman JS, Beckman TW, Chen J, Marshall PA, Freeman BA. Proc. Natl. Acad. Sci. USA. 1990;87:1620–1624. doi: 10.1073/pnas.87.4.1620. [DOI] [PMC free article] [PubMed] [Google Scholar]


