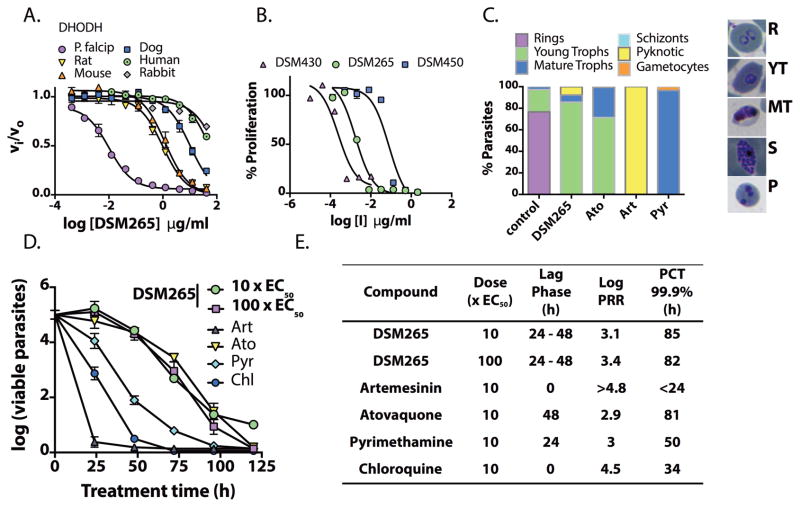
Fig. 2. In vitro activity of DSM265 and its analogs on DHODH and P. falciparum parasites.
(A) DHODH inhibition. IC50 values are reported in Table 1. Error bars show the standard error of the mean (SEM) for 3 technical replicates per concentration. Each fitted IC50 was obtained from 30 – 33 data points per fit. (B) In vitro P. falciparum 3D7 growth inhibition. Fitted EC50’s were 0.0018 (0.0011 – 0.0028), 0.079 (0.042 – 0.15) and 0.00020 (0.00011 – 0.00056) μg/mL for DSM265, DSM450 and DSM430, respectively, with the 95% confidence intervals in parenthesis (3 technical replicates per concentration and 18 – 24 data points per fit, the plot shows mean ± SEM). (C) Effects on P. falciparum 3D7 blood-stage phenotype and development. Cells were treated with drug at 10xEC50 and parasites were evaluated by microscopy 48 h after drug addition (minimally 200 cells were counted per condition). Atovaquone (Ato), artemisinin (Art), pyrimethamine (Pyr) were used as controls. Images of representative parasites from the counted stages are displayed (R, rings; YT, young trophozoite; MT, mature trophozoite; S, schizont; P, pyknotic). (D) In vitro killing curves for treatment of P. falciparum 3D7 blood-stage parasites. Data for 10x and 100xEC50 (where EC50=0.0046 μg/mL) (4 technical replicates showing the mean and standard deviation (SD)) are displayed for DSM265. Data for Art, Ato, Pyr and chloroquine (Chl) were previously reported (33). (E) Comparative DSM265 kill rates calculated from Fig. 2D. Parasite Reduction Ratio (PRR), the log number of parasites killed per asexual life cycle (48 h), Lag Phase, time before parasite killing begins, and parasite clearance time (PCT), time to achieve 99.9% parasite kill. Primary data are provided in Table S19.

